Porisma

Worked solution

Match a function to its derivative

The diagrams below show the graph of ff and its derivative f′f^{\prime}. State clearly, with reasons, which is the graph of ff and that of f′f^{\prime}.

Expand diagram

Use the scrollbars or arrow keys to inspect details.
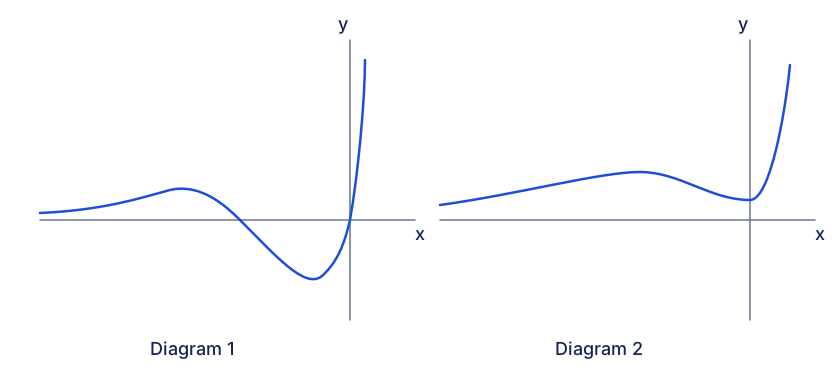
Diagram 1 is positive on the far left, crosses to negative at a negative x and crosses back to positive at x=0. Diagram 2 rises to a maximum at the first zero of Diagram 1, falls to a minimum on the y-axis above the x-axis, then rises sharply. These independent schematics preserve the source qualitative relationships; no numerical formula or extra coordinates are assigned.

[2007/ACJC/II/1]

CJC · Discussion · Question 1

Answer

Diagram 2 is f; Diagram 1 is its derivative.

Identify the function

Diagram 2 is the graph of f; Diagram 1 is the graph of its derivative.

How did this part go?

Explain the stationary minimum

Diagram 2 has a minimum at x=0x=0. Its derivative must be zero there and change from negative to positive. Diagram 1 crosses the x-axis at zero in precisely that way. The earlier maximum of Diagram 2 likewise corresponds to the earlier positive-to-negative zero of Diagram 1.

How did this part go?

Common mistakes

A zero of the function itself is not a zero-gradient condition.

Solution notes

The source gives schematic shapes, not formulas. The independent two-panel prompt preserves their relative extrema, zeros and sign relationships without assigning invented coordinates.

Read the hint