Discussion questions · Section 1 of 3
Questions 1–6 in this collection
Match a function to its derivative · Sketch a derivative from a maximum and asymptotes · +4 more
- 1
The diagrams below show the graph of and its derivative . State clearly, with reasons, which is the graph of and that of .
Expand diagramFit diagram to page
Use the scrollbars or arrow keys to inspect details.
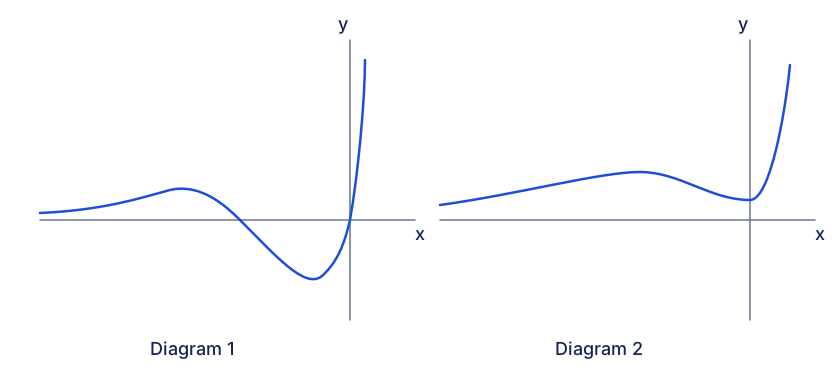
Diagram 1 is positive on the far left, crosses to negative at a negative x and crosses back to positive at x=0. Diagram 2 rises to a maximum at the first zero of Diagram 1, falls to a minimum on the y-axis above the x-axis, then rises sharply. These independent schematics preserve the source qualitative relationships; no numerical formula or extra coordinates are assigned. [2007/ACJC/II/1]
CJC · Discussion · Question 1
- 2
The diagram shows the graph of . It has a maximum point and asymptotes and . The drawing also shows the curve passing through the origin and .
Sketch the graph of , where is the gradient function of , showing the relevant features of the graph.
Expand diagramFit diagram to page
Use the scrollbars or arrow keys to inspect details.
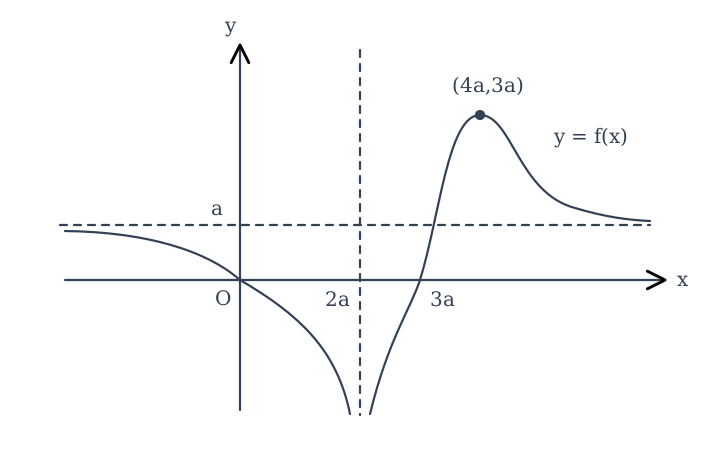
Given f: horizontal asymptote y=a and vertical asymptote x=2a. The decreasing left branch crosses the origin and tends to negative infinity at 2a from the left. The right branch rises from negative infinity, crosses at 3a, reaches the maximum (4a,3a), then decreases towards y=a from above. [2007/MJC/I/9]
CJC · Discussion · Question 2
- 3
The diagram shows the graph of . Its intersections with the axes are , and . The asymptotes are and .
Sketch the graph of , making clear the main relevant features.
Expand diagramFit diagram to page
Use the scrollbars or arrow keys to inspect details.
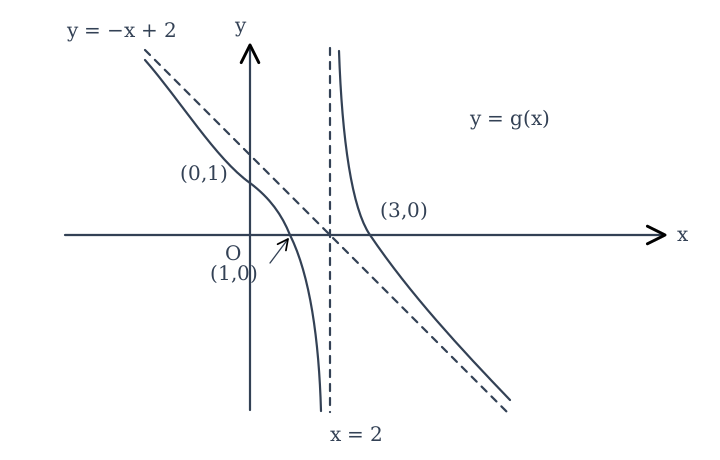
Given decreasing g: intercepts (0,1), (1,0), and (3,0), vertical asymptote x=2 and sloping asymptote y=−x +2. The left branch falls to negative infinity at 2 from the left; the right branch falls from positive infinity at 2 from the right. [2013/VJC/Promo/10(ii)]
CJC · Discussion · Question 3
- 4
The diagram shows the graph of . Given that for , , sketch the graph of .
The supplied modulus graph has vertical asymptote , horizontal asymptote , and a zero at .
Expand diagramFit diagram to page
Use the scrollbars or arrow keys to inspect details.
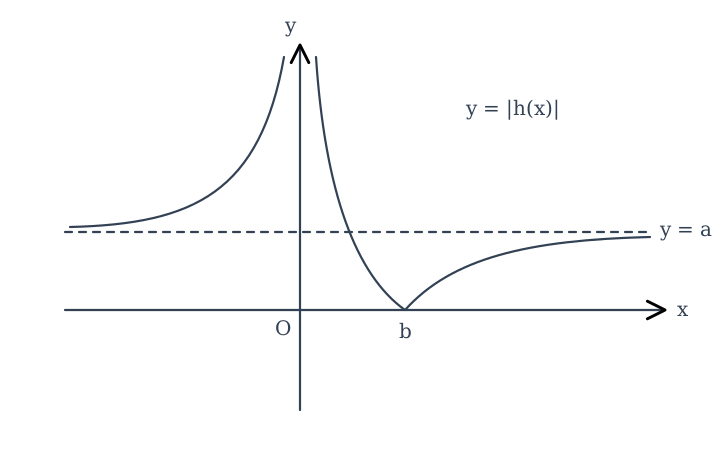
Given modulus graph |h(x)|: a positive left branch increases from horizontal asymptote y=a towards infinity at x=0. On the right, the graph falls from infinity to zero at x=b, then rises towards y=a from below. The point b is positive. [2010/IJC/Promo/6b]
CJC · Discussion · Question 4
- 5
The diagram shows . The curve cuts the x-axis at and , has a stationary point at , and has asymptote .
(i) State the x-coordinates of the stationary points of and determine the nature of each.
(ii) State the ranges of for which is (a) strictly increasing, (b) concave downwards.
Expand diagramFit diagram to page
Use the scrollbars or arrow keys to inspect details.
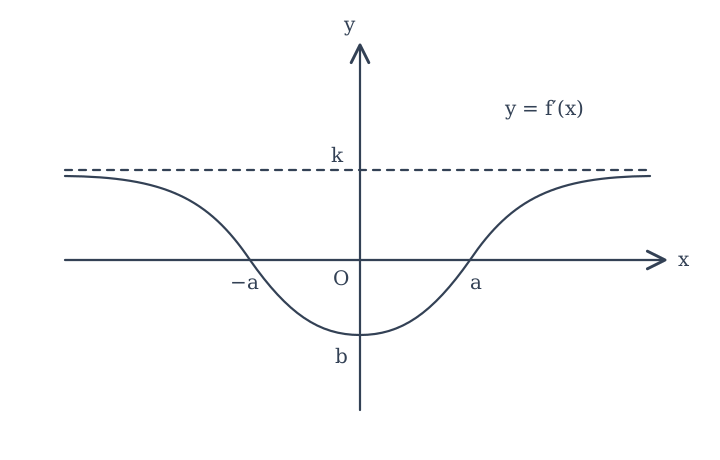
Given gradient graph f′: horizontal asymptote y=k above the x-axis, zeros at −a and a, and minimum (0,b) below the x-axis. The graph decreases for x<0 and increases for x>0, with positive tails and negative values between the zeros. [2008/IJC/Promo/6]
CJC · Discussion · Question 5
- 6
The diagram shows , passing through the origin with turning points and . The x-axis and are its two asymptotes.
(i) Find the range of for which is strictly increasing and concave downwards.
(ii) State the x-coordinates and natures of all stationary points of .
(iii) Given , sketch for , clearly indicating all stationary points, asymptotes and intersections with the axes.
Expand diagramFit diagram to page
Use the scrollbars or arrow keys to inspect details.
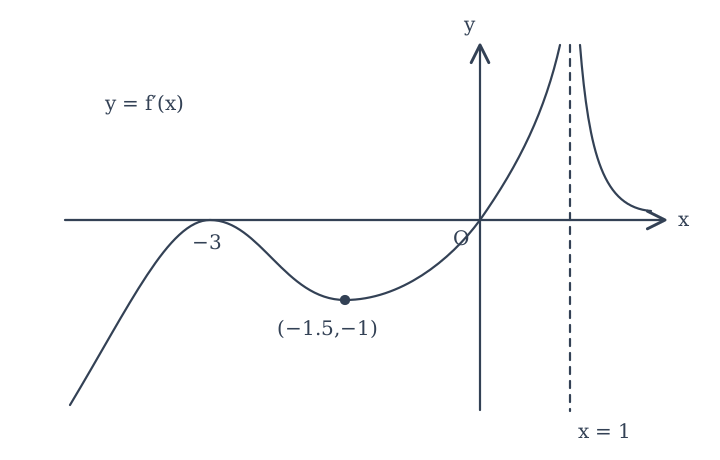
Given f′ passes through (−3,0), where it touches the x-axis from below, has minimum (−1.5,−1), then crosses the origin and rises towards positive infinity at x=1 from the left. For x>1 it falls from positive infinity towards horizontal asymptote y=0. [2009/HCI/I/3]
CJC · Discussion · Question 6