Worked solution
Pool battery samples before calculating a test
A consumer association tests a battery type claimed to have mean lifetime 150 hours. A random sample of 70 lifetimes gives , . Test against : find the p-value and explain it in context.
A second random sample of 50 lifetimes gives , . Combine the samples into one and test the same hypotheses at 10%.
[2008/H1/10]
CJC · Discussion · Question 5
Answer
First sample: full-precision approximate (source rounded-input result .0978). Pooled sample: approximate (source .0501); reject at 10%.
First sample: estimates and lower tail
For , and Under , use by CLT with variance estimated from the sample. Then and the lower-tail p-value is 0.09748169520, about 0.0975 to 3 s.f. The printed .0978 comes from rounding the mean to 147.39 before the test; its screen shows , , . Both versions are retained as distinct numerical calculations.
Explain what the p-value conditions on
Assuming the population mean is 150 h and the stated large-sample reference model is suitable, the estimated probability of a random size-70 sample mean at or below the observed 147.3857142857 h is about .09748. The printed explanation uses its rounded threshold 147.39 and value .0978. Neither is the probability that the null hypothesis itself is true.
Pool raw summaries, not sample variances
Assume independent samples from the same unchanged population. Pool , , . Thus and Do not simply average the two sample variances or means without the sample-size weights.
Pooled p-value and critical-value decisions
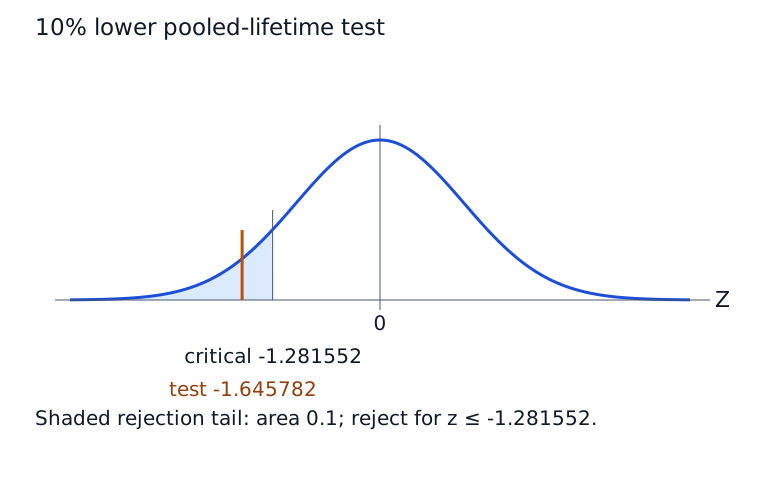
Under , . Then and the lower-tail , so reject: sufficient evidence at 10% that population mean life is below 150 h. Equivalently, , the 10% lower critical value. The source enters rounded and variance 381.21 (), yielding , . The requested 10% decision agrees; numerically the two calculations fall on opposite sides of 5%, illustrating why intermediate precision matters. This does not remove uncertainty in the approximate model.
Compare your sketch
Expand diagramFit diagram to page
Use the scrollbars or arrow keys to inspect details.
Common mistakes
Rounding the mean before standardising changes the pooled p-value across the 5% numerical cutoff. Keep source and full-precision results distinct; the asked 10% decision remains the same.