Worked solution
Use overlap bounds before adding the conditional information
For events A and B, and .
(i) Find the greatest and least possible values of .
It is given in addition that .
(ii) Find .
(iii) Find .
(iv) Determine if A and B are independent.
(v) Another event C satisfies , and . Find .
[2016/RI/P2/10]
CJC · Discussion · Question 6
Answer
(i) greatest , least ; (ii) ; (iii) ; (iv) independent; (v) .
(i) Greatest possible overlap
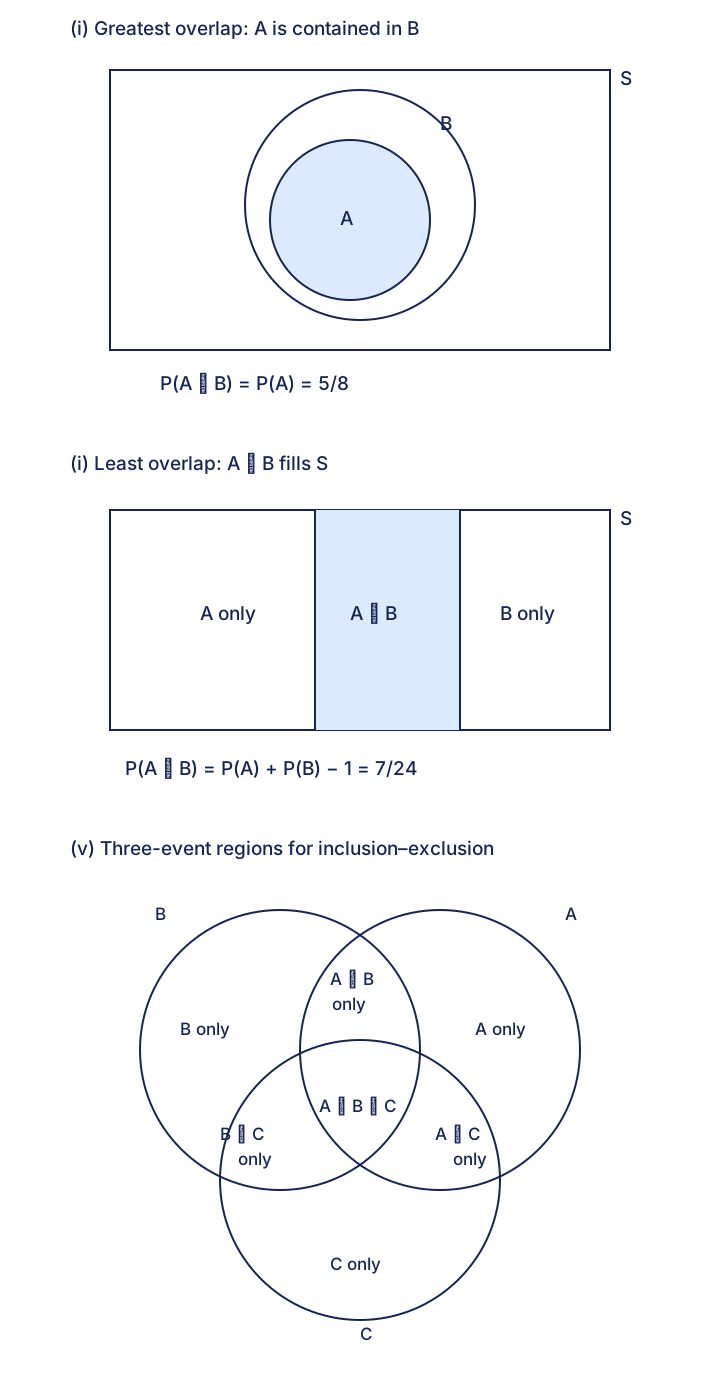
The overlap cannot exceed the smaller marginal. Since , the maximum is , attained when A is contained in B, as in the source’s nested-circle construction.
(i) Least possible overlap
Inclusion–exclusion gives . Equality is attained when fills the sample space. The source’s overlap-strip construction and highlighted explanation illustrate this equality case. These extremes use only the two initial marginals, before the later conditional datum.
(ii) Apply the given conditional probability
. Thus gives .
(iii) Complement the outside-both region
By De Morgan’s law, .
(iv) Method 1: compare the intersection with the product
From , the intersection is . Also . Equality proves independence.
(iv) Method 2: the source’s complement criterion
. Since , the complement events A′ and B′ are independent. Independence is preserved by taking complements, so A and B are independent too.
(v) Use three-event inclusion–exclusion
Substitute the source values:
Hence . The retained three-circle region diagram shows why the triple overlap is restored once after subtracting all pairwise overlaps.
Compare your sketch
Expand diagramFit diagram to page
Use the scrollbars or arrow keys to inspect details.
Common mistakes
The bounds in(i) precede the extra conditional information. Independence must be established from the later data, not assumed to obtain the bounds.
Solution notes
All five asks, both independence methods, all three source diagram panels and highlighted minimum-overlap reasoning retained. Shapes are schematic, not probability-area diagrams. All native text retained; no marks printed.