Definite integrals, areas and volumes
Definite integrals, areas and volumes · Diagrams · Complete reading
From the source curve to left and right rectangle sums
Compare left and right rectangle sums
Illustrative curve f(x) = 2 + x − x² on [0, 1.5]. Change the strip count and endpoint rule; the source drawing supplies a rising-then-falling shape, not this formula.
Teaching and source notes
The original shows the area A, then left heights f(xᵢ) and right heights f(xᵢ₊₁), with equal width Δx = (b − a)/n. The explorer keeps those choices and adds a midpoint comparison using the existing workbench.
The chosen numerical example rises and then falls. Its exact integral is [2x + x²/2 − x³/3] from 0 to 1.5, which is 3. The formula, bounds and value are illustrative, not extra givens in the source.
On a nonmonotone curve, the endpoint name alone does not prove that a sum is below or above the integral. Inspect the whole interval. Increasing n numerically illustrates convergence; it does not prove the general theorem.
Signed integrals and areas
Equal areas, opposite signed integrals
Use the source sine intervals: [−π, 0], [0, π] and [−π, π]. Compare the signed integral with the total geometric area. Decimal axis labels approximate the exact preset bounds.
Teaching and source notes
The source sine regions each have geometric area 2. Their signed integrals are −2 and +2, so the combined signed integral is 0 while the geometric area is 4. The explorer retains those exact preset intervals in radians.
For a region above the axis, area is the integral. Below the axis, area is the negative of the integral. Across a sign change, split the interval and add the nonnegative areas; taking the absolute value of the combined integral can lose area.
Shaded running areas are numerical estimates, compared with the antiderivative −cos x. Rounded numerical agreement does not replace the analytic evaluation or the sign split.
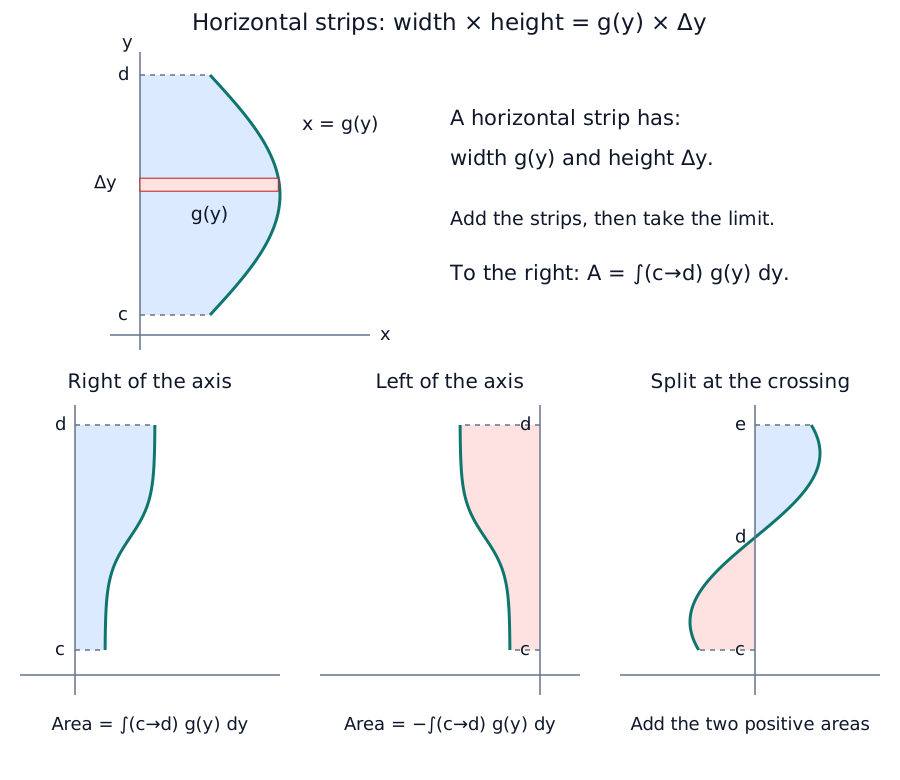
Horizontal strips and the y-axis
Expand diagramFit diagram to page
Use the scrollbars or arrow keys to inspect details.
Derive upper minus lower
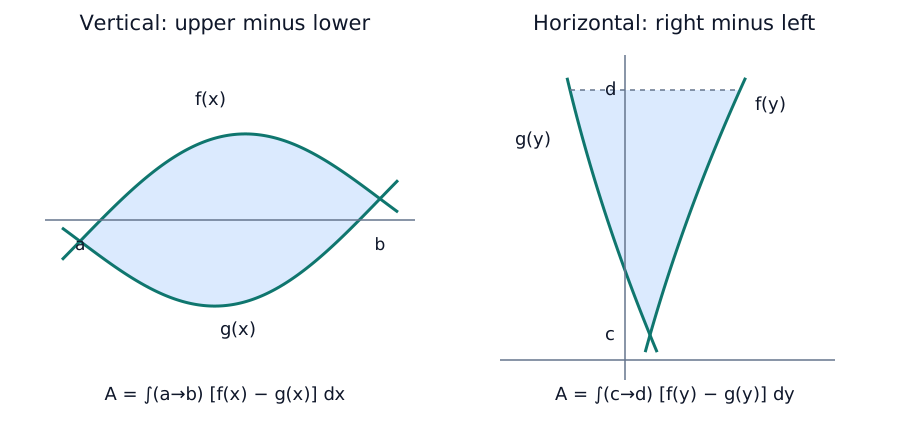
Build area from upper minus lower
Illustrative curves f(x) = 2x − x² and g(x) = x² on [0, 1]. Inspect a strip's two heights before multiplying their difference by its width.
Teaching and source notes
The source derives A = F − G by subtracting the area under the lower curve from that under the upper curve, between their meeting points a and b. The numerical formulas here are labelled illustrative rather than attributed to the original sketch.
For f(x) = 2x − x² and g(x) = x², f − g = 2x(1 − x) is nonnegative on [0, 1]. The curves meet at both endpoints. Integrating the upper curve gives 2/3, the lower gives 1/3, and their difference is 1/3.
The same bounds and consistent upper/lower ordering are essential. If curves cross within an interval, split before summing geometric areas. A finite strip sum is still an approximation.
Choose vertical or horizontal strips
Expand diagramFit diagram to page
Use the scrollbars or arrow keys to inspect details.
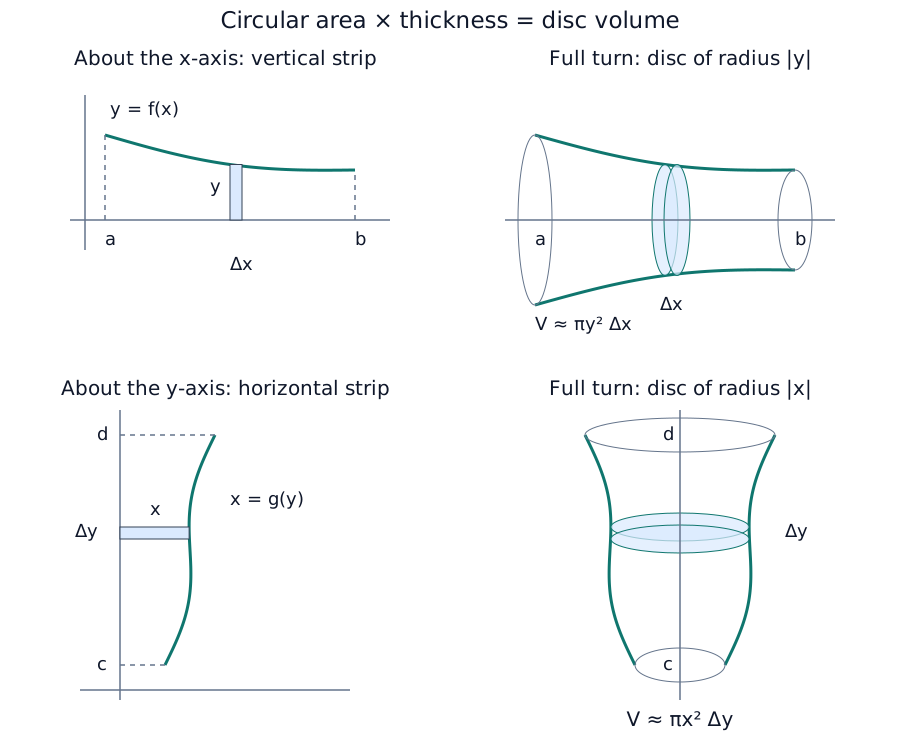
A strip rotates into a disc
Expand diagramFit diagram to page
Use the scrollbars or arrow keys to inspect details.
Recognise cylinders and full cones
Expand diagramFit diagram to page
Use the scrollbars or arrow keys to inspect details.
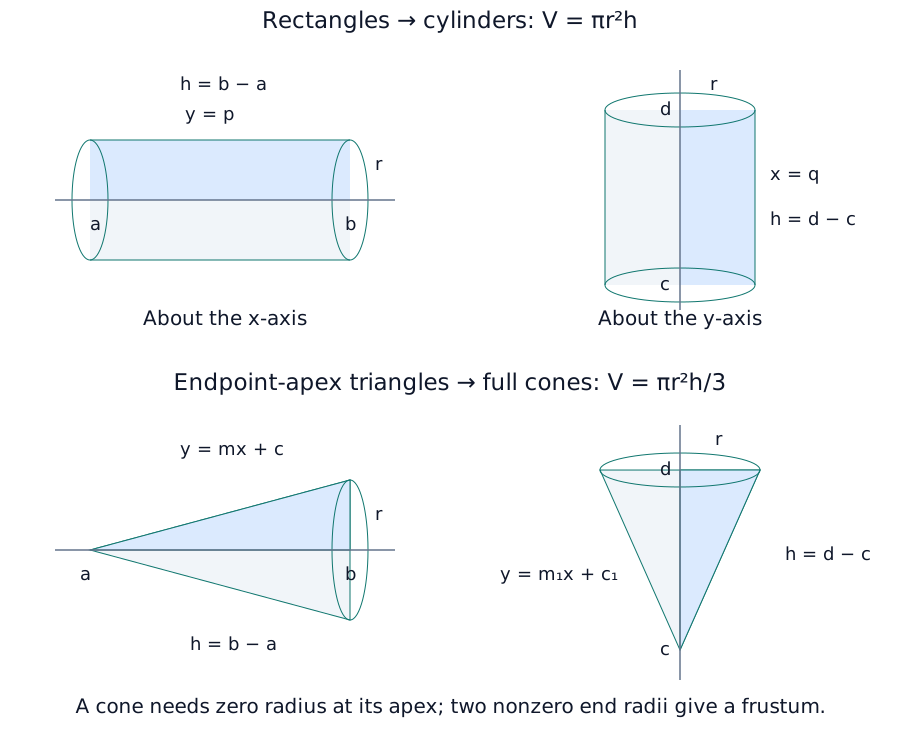
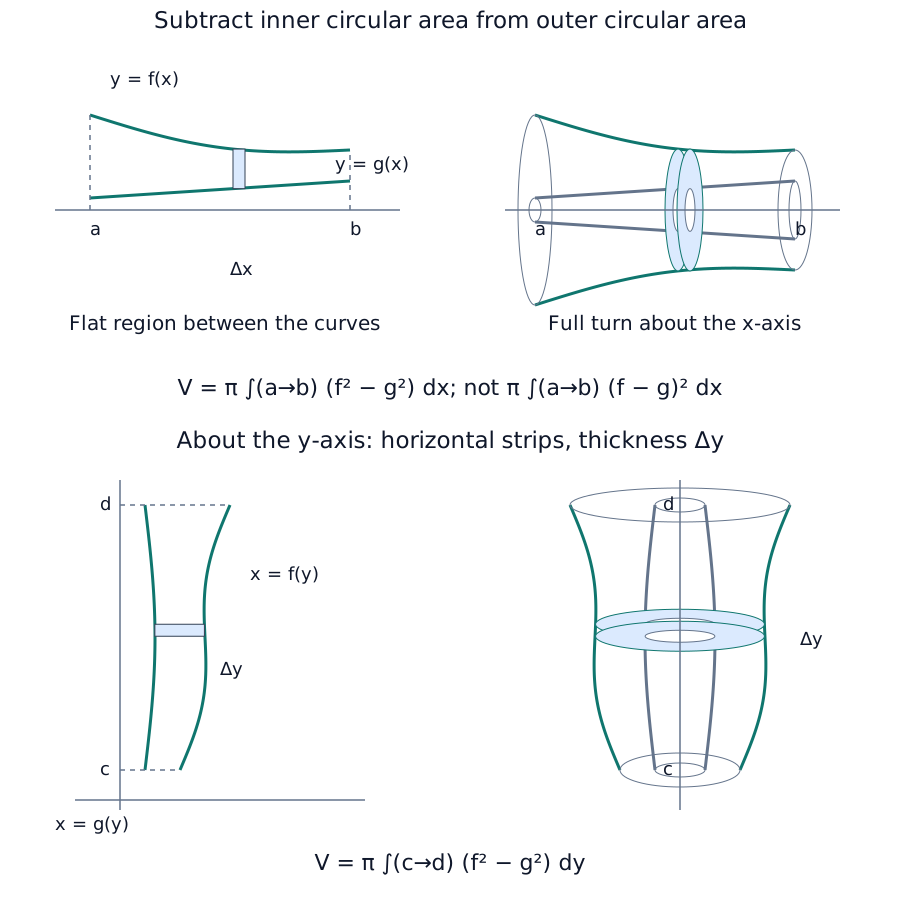
Strips rotate into washers about either axis
Expand diagramFit diagram to page
Use the scrollbars or arrow keys to inspect details.