Porisma
Back to reading

Discrete random variables

Discrete random variables · Diagrams

Choose another diagram

A running average from the printed coin experiment

Expand diagram

Use the scrollbars or arrow keys to inspect details.
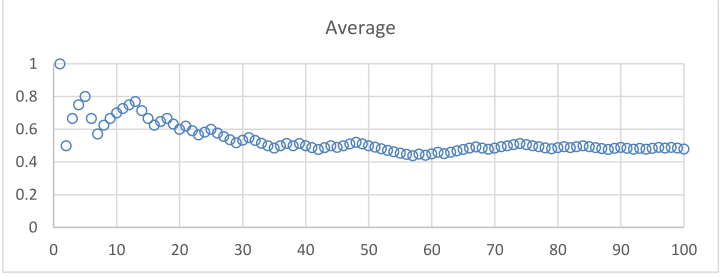
Teacher PDF 8 exact running-average plot: horizontal 0–100 tosses, vertical 0–1, one hundred open blue circles fluctuate early then settle near one half. Student copy has blank axes. Source points preserved rather than simulated.
Open original diagram (new tab)
Back to reading