Porisma
Back to reading

Discrete random variables

Discrete random variables · Diagrams

Choose another diagram

The same centre with different spreads

Expand diagram

Use the scrollbars or arrow keys to inspect details.
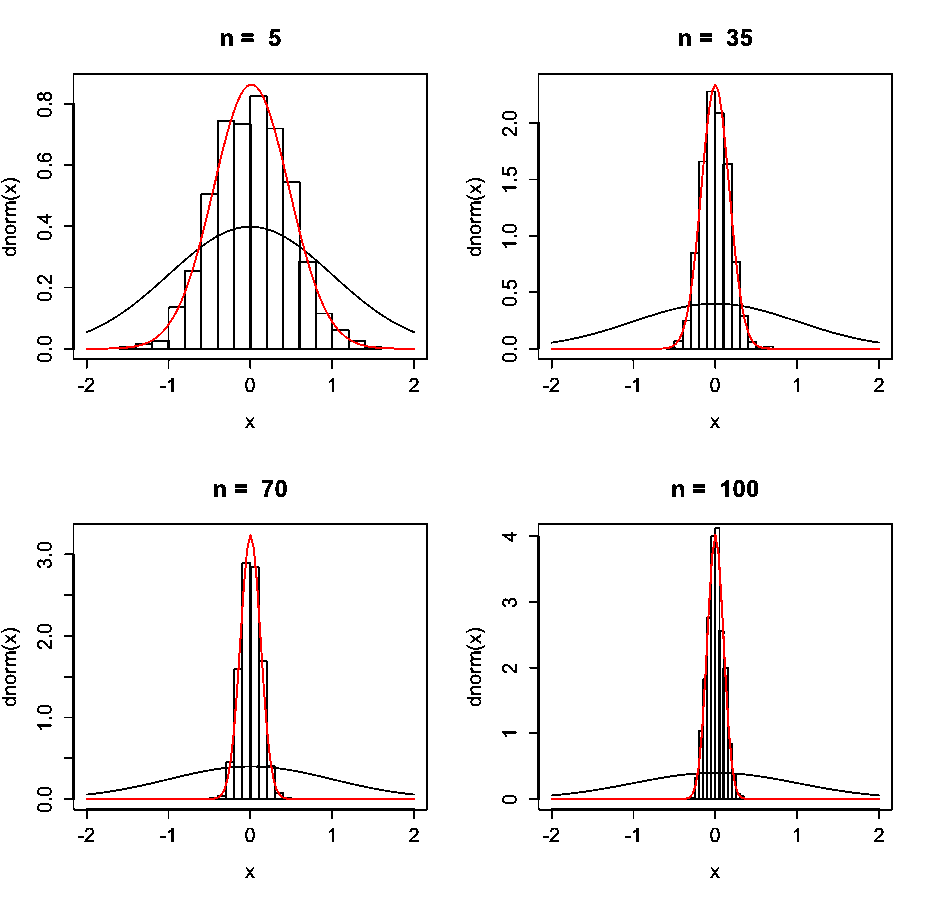
Four source panels traced as native SVG: n=5,35,70,100, each centred at 0 with x ticks −2,−1,0,1,2; histogram, red narrow curve and broad black curve retained. Vertical label dnorm(x); labelled ticks are 0,.2,.4,.6,.8 for n5;0,.5,1,1.5,2 for n35;0,1,2,3 for n70;0,1,2,3,4 for n100. Compare horizontal spread, not heights across different scales. Printed attribution: University of Pennsylvania.
Open original diagram (new tab)
Back to reading