Use the scrollbars or arrow keys to inspect details.
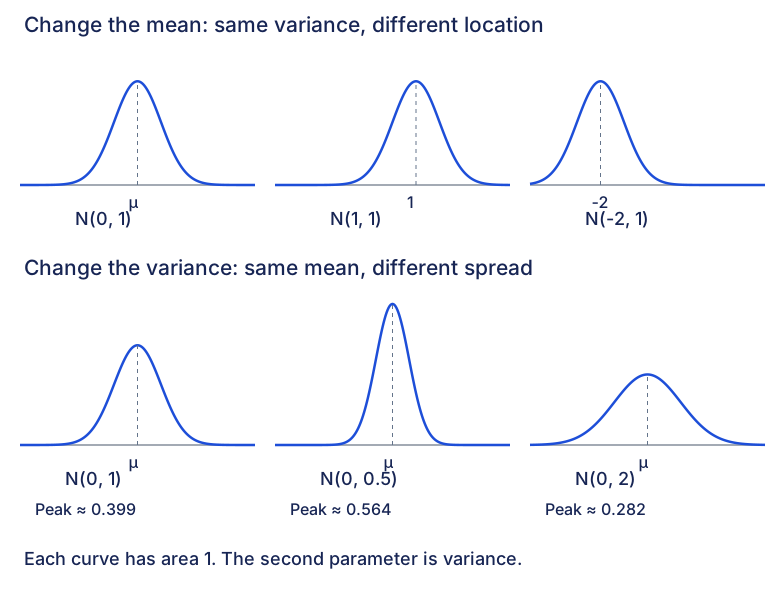
Six normal curves. With variance 1, means 0, 1 and −2 shift the location. With mean 0, variances 1, 0.5 and 2 give peaks of approximately 0.399, 0.564 and 0.282 respectively. Smaller variance gives a narrower, taller curve. The source spread figures were corrected to use the printed variance convention.Open original diagram (new tab)