Porisma
Back to reading

The normal distribution

The normal distribution · Diagrams

Choose another diagram

Areas within standard deviations

Expand diagram

Use the scrollbars or arrow keys to inspect details.
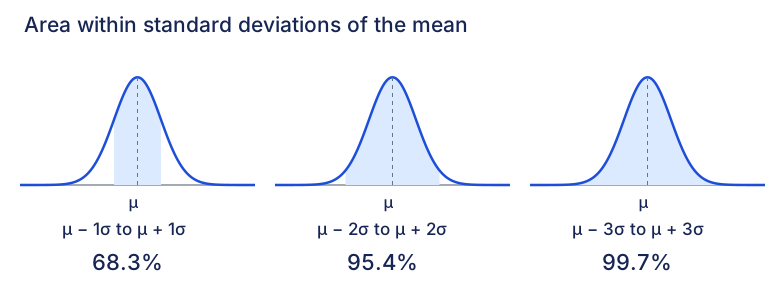
Areas between μ−σ and μ+σ approximately 68.3%; μ−2σ and μ+2σ approximately 95.4%; μ−3σ and μ+3σ approximately 99.7%. All three shaded regions are centred at the mean.
Open original diagram (new tab)
Back to reading