Worked solution
Explain the product of infected and susceptible proportions
Find the general solution of , , , in the form . marks
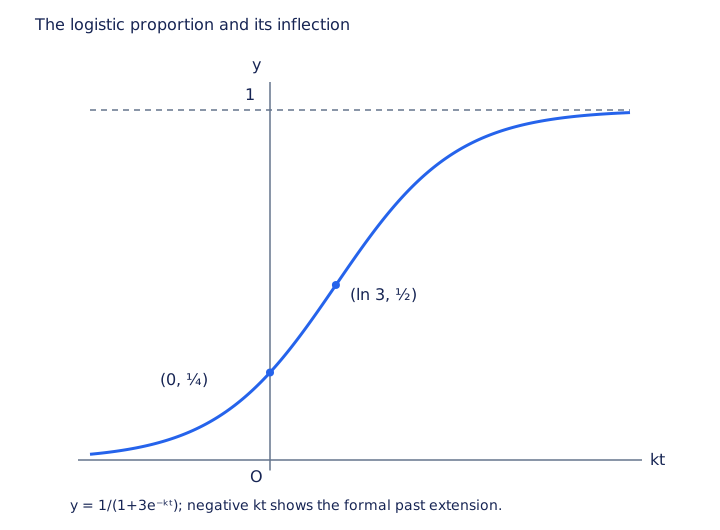
Find the particular solution with , and sketch it. marks
Here models the proportion infected by a disease. Explain why the differential equation may be suitable. marks
[2013/RVHS/II/1]
CJC · Review problems · Question 8
Answer
, ; particular , with inflection .
Integrate on the stated proportion interval
. Hence , since the ratio is positive. Thus with , giving . The equilibrium endpoints are outside this question’s explicit strict range.
Apply the initial proportion and sketch the sigmoid
gives , so . It increases through , approaches as , and its formal past limit is . Since , it is initially concave up and changes to concave down at . The formula-based sketch resolves the early concavity that the rough source sketch does not distinguish.
Explain both factors in the rate
More infected people, represented by , create more opportunities to pass on infection. More susceptible people, represented by , create more opportunities for those contacts to cause new infections. Under homogeneous mixing the rate is proportional to their product , with positive proportionality constant .
Compare your sketch
Expand diagramFit diagram to page
Use the scrollbars or arrow keys to inspect details.
Common mistakes
An initial proportion below one half gives an initially concave-up sigmoid, not a curve concave down for all future time.