Differential equations
Practice section 6 of 6
Questions 31–35 in this collection
Practice questions
Review practice · 1 of 5
Derive and calibrate a logistic population model
A town has population . The number infected after days satisfies , .
(i) Given , show . [6]
(ii) Given , find when of the population is infected. [3]
(iii) State one contextual assumption needed for the model. [1]
[2013/JJC/II/2]
CJC · Review problems · Question 6
Solution
Review practice · 2 of 5
Derive the insect model and restore its zero equilibrium
An insect population after weeks satisfies , . Show, rather than merely verify, the general solution . [4]
Initially there are insects and the population tends to after a very long time. Find the time to reach three times the initial population, to the nearest day. [3]
[2013/RI(JC)/I/7]
CJC · Review problems · Question 7
Solution
Review practice · 3 of 5
Explain the product of infected and susceptible proportions
Find the general solution of , , , in the form . [3]
Find the particular solution with , and sketch it. [3]
Here models the proportion infected by a disease. Explain why the differential equation may be suitable. [2]
[2013/RVHS/II/1]
CJC · Review problems · Question 8
Solution
Review practice · 4 of 5
Balance constant inflow against volume-dependent outflow
A tank initially contains . Water enters at and leaves at a rate proportional to the volume . When , the net rate is . Set up and solve a differential equation to show . [7]
(i) Describe what happens to the volume eventually. [1]
(ii) Sketch against . [2]
[2013/MJC/I/7]
CJC · Review problems · Question 9
Solution
Review practice · 5 of 5
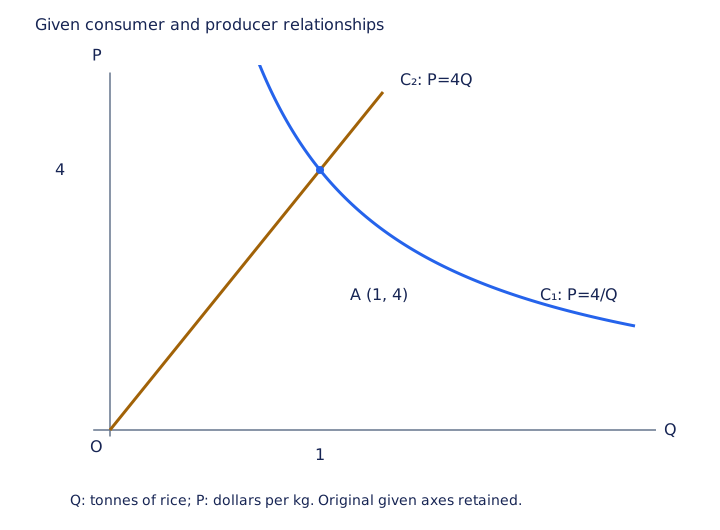
Fit a price adjustment to the shortage between two curves
The given diagram has quantity tonnes on the horizontal axis and price dollars per kg on the vertical axis. Consumer curve and producer line meet at . Consumer quantity is inversely proportional to price, while producer quantity is directly proportional to price.
(i) Interpret in context.
(ii) Find both equations, expressing in terms of .
A shortage occurs when consumer quantity exceeds producer quantity. The rate of increase of price after months is proportional to this shortage.
(iii) Given an initial price of $3 and a price of $3.65 after one month, find and sketch it, showing its long-term behaviour. Suggest why producers might use , , instead of .
Expand diagramFit diagram to page
Use the scrollbars or arrow keys to inspect details.
[2017/NJC/I/10(b)]
CJC · Review problems · Question 10