Porisma

Worked solution

Sketch the gradient across a pole and a minimum

The graph of y=f(x)y=f(x) has asymptotes x=2x=2, y=−3y=-3 and minimum (−2,−5)(-2,-5), as shown. Sketch y=f′(x)y=f^{\prime}(x), clearly indicating any asymptotes, turning points and axial intercepts. marks

The supplied graph also labels x-intercepts 1,41,4 and y-intercept −3-3.

Expand diagram

Use the scrollbars or arrow keys to inspect details.
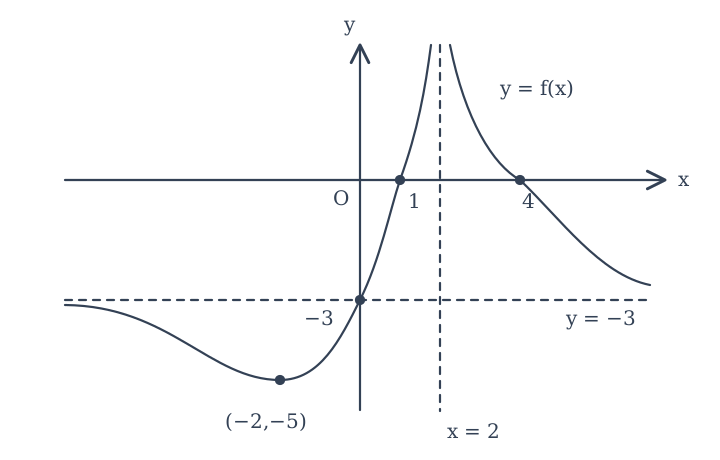
Given function with vertical asymptote x=2 and horizontal asymptote y=−3. The left branch initially falls below −3, reaches minimum (−2,−5), then rises through (0,−3) and (1,0) to positive infinity at 2 from the left. The right branch falls from positive infinity at 2 from the right, crosses (4,0), then tends to −3 from above.

[2009/CJC/Promo/10(c)]

CJC · Review problems · Question 2

Answer

Derivative zero (−2,0)(-2,0); printed asymptotes x=2x=2, y=0y=0; one unlabelled minimum to the left of −2-2.

Convert the rises and falls to gradient signs

The left branch decreases until x=−2x=-2, then increases up to x=2x=2; the right branch decreases throughout. Thus f′<0f^{\prime}<0 for x<−2x<-2, f′(−2)=0f^{\prime}(-2)=0, f′>0f^{\prime}>0 for −2<x<2-2<x<2, and f′<0f^{\prime}<0 for x>2x>2. The derivative crosses at (−2,0)(-2,0) from negative to positive.

How did this part go?

Retain the complete printed gradient sketch

The source draws horizontal asymptote y=0y=0 and vertical asymptote x=2x=2. The left derivative branch approaches zero from below at the far left, passes through an unlabelled minimum at an x-value below −2-2, then rises through (−2,0)(-2,0) to +∞+\infty at 2−2^-. The right branch rises from −∞-\infty at 2+2^+ towards zero from below. No coordinate is supplied for the unlabelled minimum or the derivative y-intercept.

How did this part go?

Keep the original intercepts separate

The original zeros 1,41,4 and y-intercept −3-3 do not specify zeros or numerical intercepts of the derivative. The supplied smooth gradient sketch is qualitative; its asymptotic slope behaviour is retained as part of the printed interpretation, not as an unrestricted theorem that an asymptote alone determines derivative limits.

How did this part go?

Compare your sketch

Expand diagram

Use the scrollbars or arrow keys to inspect details.
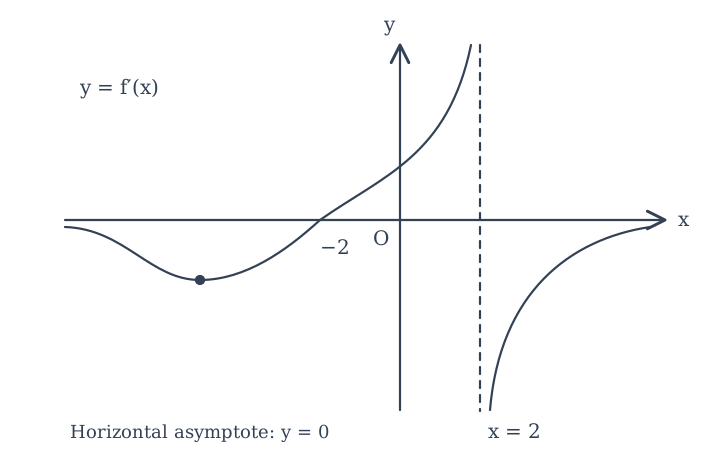
Printed derivative sketch has asymptotes y=0 and x=2. Its left branch starts below zero, reaches an unlabelled minimum to the left of −2, then rises through (−2,0) to positive infinity at 2 from the left. The right branch rises from negative infinity towards zero from below.

Common mistakes

The minimum’s original y-coordinate −5 does not become a derivative value.

Read the hint