Worked solution
Reconstruct a decreasing function with an isolated zero gradient
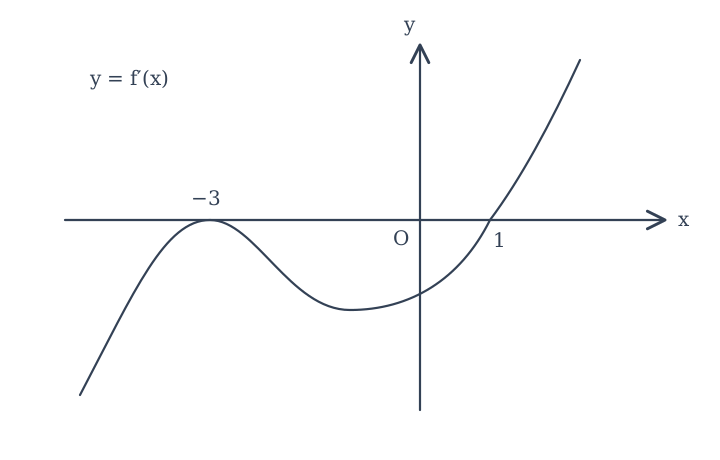
The diagram shows meeting the x-axis at and . Given and :
(i) State the coordinates and natures of the stationary points of . marks
(ii) Find the range of for which the curve is strictly decreasing. marks
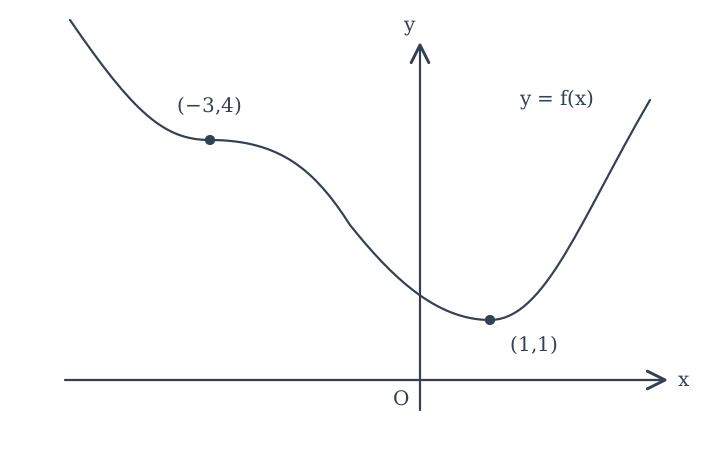
(iii) Sketch . marks
Expand diagramFit diagram to page
Use the scrollbars or arrow keys to inspect details.
[2010/TPJC/I/6]
CJC · Review problems · Question 5
Answer
Stationary inflection ; minimum . Printed negative-gradient ranges exclude , but the function strictly decreases through it on .
(i) Classify the two labelled stationary points
is a stationary point of inflection: touches zero from below at and changes from increasing to decreasing. is a minimum, since changes from negative to positive at .
(ii) Compare negative gradients with strict monotonicity
The printed answer gives or , the ranges where . There is an isolated zero at , not a constant interval. Thus, as a statement about the function’s strict monotonicity, is strictly decreasing throughout , including through its stationary inflection at . A derivative may vanish at an isolated point of a strictly decreasing function.
(iii) Retain both source coordinate anchors
The source function decreases from the upper left, flattens through the stationary inflection , steepens again, and reaches the minimum before increasing. It stays above the x-axis. The exact y-intercept and the position of the other inflection implied by the unlabelled derivative minimum are not numerically supplied; the figure is schematic, not a uniquely determined function.
Compare your sketch
Expand diagramFit diagram to page
Use the scrollbars or arrow keys to inspect details.
Common mistakes
One isolated zero derivative does not break strict decrease.