Worked solution
Transform the given graph f(2x) without doubling a scale factor
The given graph is , passing through A=(−1,0), B=(0,2), C=(1,0), D=(3,−3). The diagram shows a right-hand horizontal asymptote y=−1.
Sketch on separate clearly labelled diagrams:
(i) ; mark
(ii) ; marks
(iii) . marks
Expand diagramFit diagram to page
Use the scrollbars or arrow keys to inspect details.
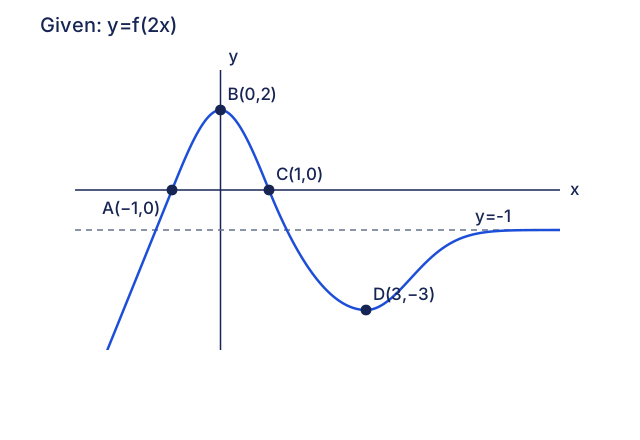
[2012/VJC/Promo/4]
CJC · Review problems · Question 1
Answer
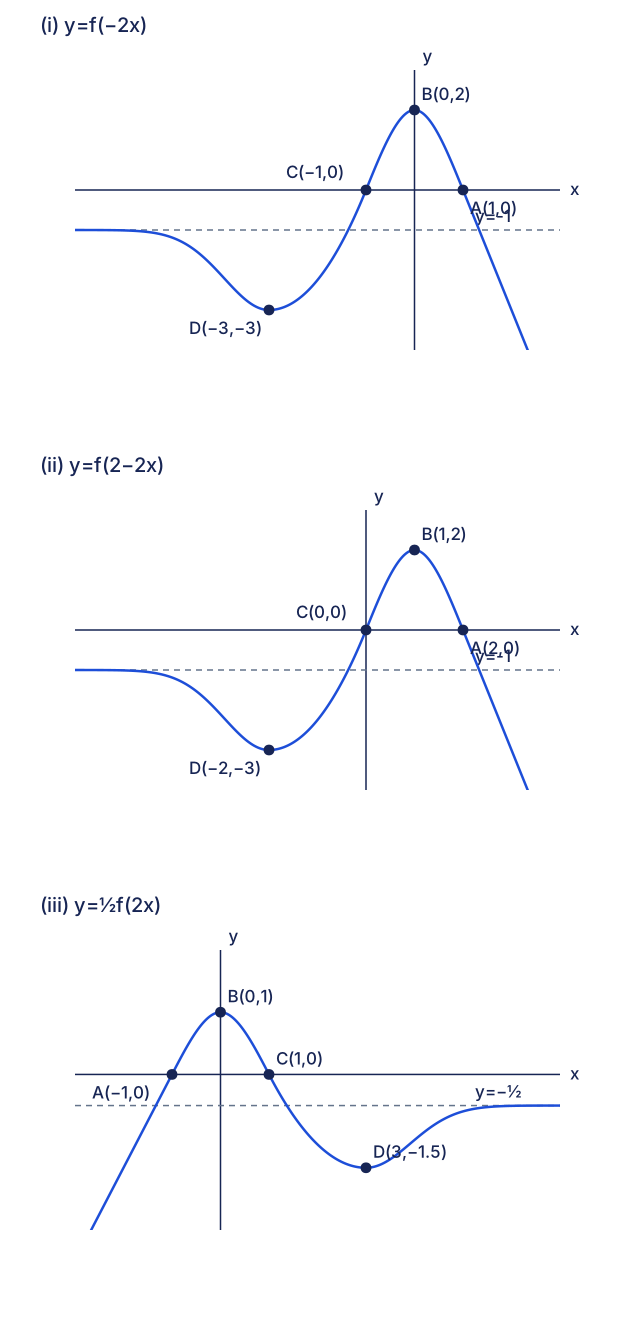
(i) A(1,0), B(0,2), C(−1,0), D(−3,−3), y=−1.
(ii) A(2,0), B(1,2), C(0,0), D(−2,−3), y=−1.
(iii) A(−1,0), B(0,1), C(1,0), D(3,−3/2), y=−1/2.
(i) Reflect the given graph in the y-axis
Let denote the graph actually supplied. Then , so . The image points are A=(1,0), B=(0,2), C=(−1,0), D=(−3,−3). The horizontal asymptote remains y=−1, approached on the left after reflection.
(ii) Reflect and translate one unit right
. Solve the input relation to obtain the point map . Thus A=(2,0), B=(1,2), C=(0,0), D=(−2,−3), with horizontal asymptote y=−1 on the left. Equivalently reflect the given graph in the y-axis, then translate one unit right.
(iii) Halve each ordinate
gives . Hence A=(−1,0), B=(0,1), C=(1,0), D=(3,−3/2). The horizontal asymptote becomes y=−1/2 on the right.
Compare your sketch
Expand diagramFit diagram to page
Use the scrollbars or arrow keys to inspect details.
Common mistakes
The given picture is not y=f(x). Treating it as f(x) would introduce the wrong horizontal scale.
Solution notes
Every printed ask, point and source asymptote retained. The three solution sketches are separate panels generated from one qualitative reconstruction; interpolation between given landmarks is illustrative, not an inferred exact formula.
The lecture Student PDF 36 / printed 108 and Teacher PDF 37 / printed 109 diagram mislabels B as (2,0), while their prose gives B=(0,2). The prose and the point on the y-axis determine the canonical coordinate (0,2); the conflicting printed label is retained in the closing native transcription and source review.