Porisma
All chapter practice

Graph transformations

Practice section 8 of 9

Questions 43–48 in this collection

Practice questions

Discussion practice · 1 of 6

Recover f from a transformed input graph before reciprocating

The given graph is G(x)=f(3−x/2)G(x)=f(3-x/2), with stationary points (8,−2), (14,2) and x-intercepts 6,10,18. The source diagram shows a vertical asymptote x=0 and left horizontal asymptote y=−4.

Sketch separately:

(a) y=1/f(3−x/2)=1/G(x)y=1/f(3-x/2)=1/G(x);

(b) y=f(x)y=f(x).

Clearly show asymptotes, stationary points and axial intercepts.

Expand diagram

Use the scrollbars or arrow keys to inspect details.
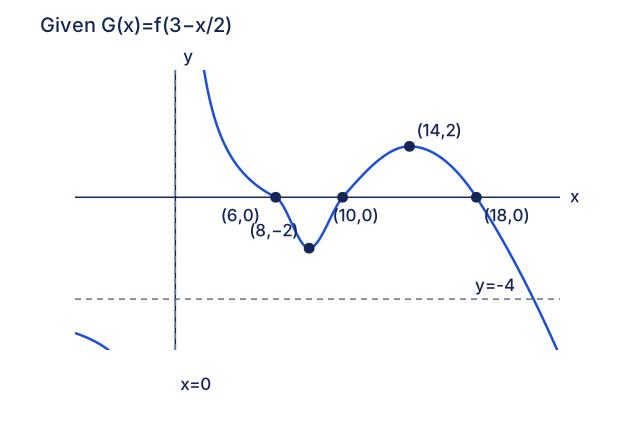
Source qualitative graph G(x)=f(3-x/2), with pole x=0, min (8,-2), max(14,2), zeros 6,10,18, left horizontal asymptote y=-4 and unbounded decreasing right tail. No exact G formula is supplied; interpolation is schematic.

[2009/AJC/I/11]

CJC · Discussion · Question 8

Solution

Discussion practice · 2 of 6

Transform a piecewise curve and crop to the requested interval

(i) State transformations taking y=x2y=x^2 to y=14(x−3)2y=\frac14(x-3)^2.

Define

f(x)={1,0≤x≤1,14(x−3)2,1<x≤3,0,otherwise.f(x)=\begin{cases}1,&0\le x\le1,\\ \frac14(x-3)^2,&1<x\le3,\\0,&\text{otherwise}.\end{cases}

(ii) Sketch f for −1≤x≤4.

(iii) Separately sketch y=1+f(x/2)y=1+f(x/2) for −1≤x≤4.

[2015/I/5]

CJC · Discussion · Question 9

Solution

Review practice · 3 of 6

Transform the given graph f(2x) without doubling a scale factor

The given graph is y=f(2x)y=f(2x), passing through A=(−1,0), B=(0,2), C=(1,0), D=(3,−3). The diagram shows a right-hand horizontal asymptote y=−1.

Sketch on separate clearly labelled diagrams:

(i) y=f(−2x)y=f(-2x); [1]

(ii) y=f(2−2x)y=f(2-2x); [2]

(iii) y=12f(2x)y=\frac12f(2x). [2]

Expand diagram

Use the scrollbars or arrow keys to inspect details.
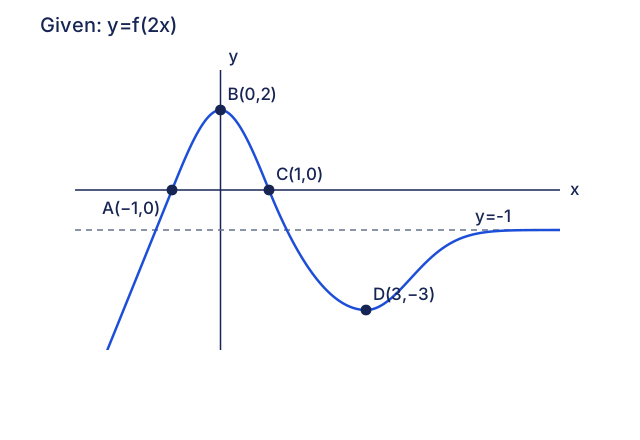
Reconstructed source schematic y=f(2x), through A(-1,0),B(0,2),C(1,0),D(3,-3), with right-hand horizontal asymptote y=-1. Curve geometry between given landmarks is qualitative, not a supplied formula.

[2012/VJC/Promo/4]

CJC · Review problems · Question 1

Solution

Review practice · 4 of 6

Map labelled points and preserve reciprocal domains

The given graph is y=f(x)y=f(x), with maximum A=(2,2), B=(4,0), C=(0,1) and vertical asymptote x=5; its left tail approaches y=0. Sketch on separate diagrams:

(i) y=f(2x−1)y=f(2x-1); [3]

(ii) y=f(x/2)−2y=f(x/2)-2; [3]

(iii) y=1/f(x)y=1/f(x); [4]

Show the corresponding A,B,C coordinates and all asymptotes where applicable.

Expand diagram

Use the scrollbars or arrow keys to inspect details.
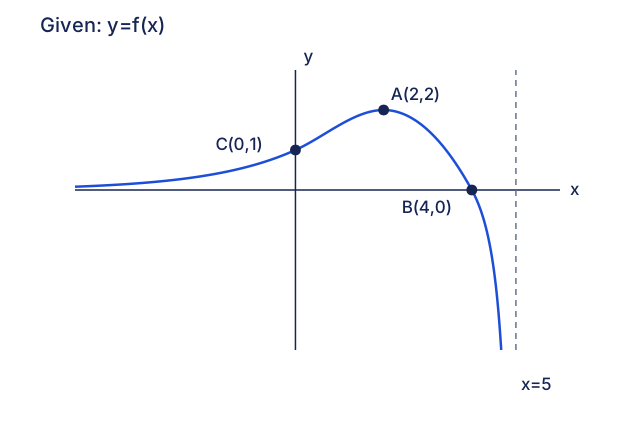
Source schematic y=f(x), A(2,2) maximum,C(0,1),B(4,0), vertical asymptote x=5 and left tail tending to y=0. Only the supplied branch x<5 is reconstructed. Interpolation is qualitative.

CJC · Review problems · Question 2

Solution

Review practice · 5 of 6

Reflect a two-branch graph and handle a reciprocal hole

The given graph y=f(x)y=f(x) intersects the axes at A=(0,−2), B=(−1,0), has minimum C=(4,0.5), and asymptotes x=1, y=3.

Sketch separately:

(i) y=f(−1−x)y=f(-1-x); [4]

(ii) y=1/f(x)y=1/f(x); [4]

Clearly indicate asymptotes, axial intercepts and corresponding A,B,C where appropriate.

Expand diagram

Use the scrollbars or arrow keys to inspect details.
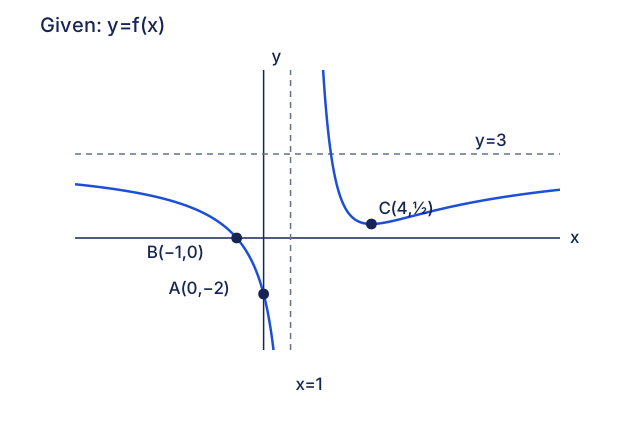
Source schematic with A(0,-2),B(-1,0), minimum C(4,1/2), asymptotes x=1,y=3. Branch shapes are qualitative and reproduce the stated landmarks and limiting behavior.

[2010/HCI/Promo/5]

CJC · Review problems · Question 3

Solution

Review practice · 6 of 6

Apply successive transformations in their stated order

(a) y=x2−1y=x^2-1 is translated 3 units in the positive x-direction, stretched by factor 2 parallel to y, then translated 2 units in the negative y-direction. Find the new equation as y=f(x)y=f(x). [3]

(b) Three successive transformations change y=h(x)y=h(x) to y=h(1−2x)y=h(1-2x). Describe them. [3]

[2011/CJC/MYE/11(modified)]

CJC · Review problems · Question 4

Solution

Back to all practice questions