Porisma

Worked solution

Take the limit of left-rectangle areas

The diagram shows part of the graph of y=x3+1y=x^3+1 from x=0x=0 to x=1x=1. The area under the curve may be approximated by the total area, AA, of nn rectangles as shown. The width of each rectangle is 1/n1/n.

Given that ∑r=1nr3=[n(n+1)2]2\displaystyle\sum_{r=1}^{n}r^3=\left[\frac{n(n+1)}2\right]^2, show that A=1+14(1−1n)2A=1+\dfrac14\left(1-\dfrac1n\right)^2.

Hence deduce the exact value of ∫01(x3+1) dx\displaystyle\int_0^1(x^3+1)\,dx.

Additional printed Student lecture ask: Construct a similar diagram so that overestimation occurs.

Expand diagram

Use the scrollbars or arrow keys to inspect details.
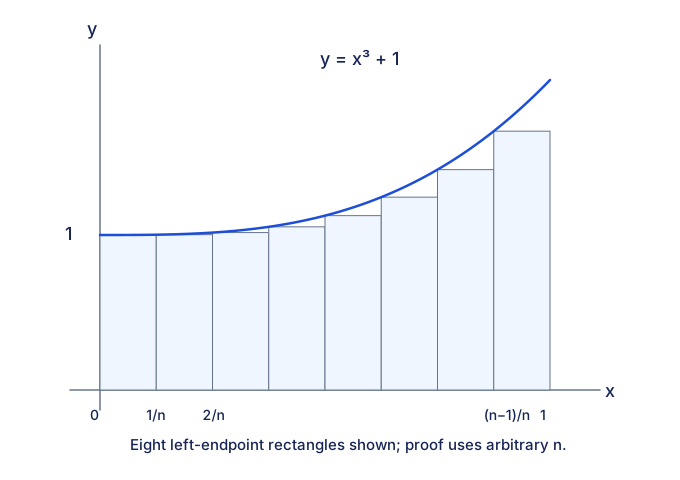
Increasing curve y=x³+1 on 0≤x≤1. Eight equal-width left rectangles illustrate the source construction for arbitrary n; each width is 1/n, first height 1, last height ((n-1)/n)³+1. Rectangles lie below the curve, with 0,1/n,2/n,(n-1)/n,1 marked on x-axis.

[2008/TPJC/II/5(modified)]

CJC · Discussion · Question 1

Answer

A=1+14(1−1/n)2A=1+\frac14(1-1/n)^2; integral 5/45/4.

Use left-endpoint heights

The first three heights are 11, (1/n)3+1(1/n)^3+1, (2/n)3+1(2/n)^3+1; the nth is ((n−1)/n)3+1((n-1)/n)^3+1. Thus

A=1n∑r=0n−1[(rn)3+1].\begin{aligned}&A\\ & =\frac1n\sum_{r=0}^{n-1}\left[\left(\frac rn\right)^3+1\right].\end{aligned}

How did this part go?

Apply the given cubic sum

A=1n4∑r=0n−1r3+1n∑r=0n−11=1n4[(n−1)n2]2+1=1+14(1−1n)2.\begin{aligned}&A\\ & =\frac1{n^4}\sum_{r=0}^{n-1}r^3\\ &{}+\frac1n\sum_{r=0}^{n-1}1\\ & =\frac1{n^4}\left[\frac{(n-1)n}{2}\right]^2+1\\ & =1+\frac14\left(1-\frac1n\right)^2.\end{aligned}

The zero term contributes nothing to the cubic sum but does contribute one to the count of rectangles.

How did this part go?

Take the limit

As n→∞n\to\infty, 1/n→01/n\to0, so

∫01(x3+1) dx=1+14=54.\begin{aligned}&\int_0^1(x^3+1)\,dx\\ & =1+\frac14\\ & =\frac54.\end{aligned}

How did this part go?

Construct overestimating rectangles

The Teacher asks why the given rectangles underestimate: x3+1x^3+1 is strictly increasing on [0,1][0,1], so each left-endpoint height is no greater than the curve across its interval. For the additional Student lecture ask, draw equal widths 1/n1/n using the right-endpoint heights 1+(r/n)31+(r/n)^3, r=1,…,nr=1,\ldots,n. Each upper-right corner touches the curve and each rectangle covers it on that subinterval, so the sum overestimates. Independently, Rn=1+14(1+1/n)2>5/4R_n=1+\frac14(1+1/n)^2>5/4, and it converges to the same integral. The displayed sketch uses eight rectangles as an illustration; the argument holds for every positive integer nn.

How did this part go?

Compare your sketch

Expand diagram

Use the scrollbars or arrow keys to inspect details.
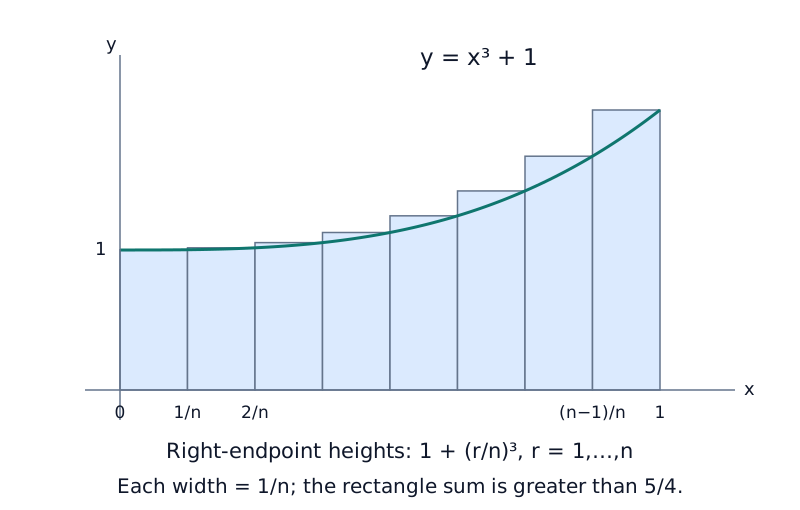
Increasing y=x³+1 on[0,1] with eight equal-width right-endpoint rectangles, each touching the curve at its upper-right corner and lying above it. For general n their heights are 1+(r/n)³ and width 1/n; sum 1+one quarter(1+1/n)² exceeds the exact area 5/4.

Common mistakes

There are n terms even though the cubic sum starts at zero.

Solution notes

Both source pages and the rectangle diagram are retained through transcription and a labelled independent reconstruction; no marks are printed.

The extra overestimation ask is printed in Student lecture PDF 28/printed 86; the Teacher lecture PDF 29/printed 87 replaces that line with a partly clipped tutor note asking why the given rectangles underestimate. Original reviewed wording and native transcription are preserved; the appended ask/working retain this source variant.

Read the hint