Discussion questions · Section 1 of 2
Questions 1–6 in this collection
Take the limit of left-rectangle areas · Integrate partial fractions with logarithm and arctangent terms · +4 more
- 1
The diagram shows part of the graph of from to . The area under the curve may be approximated by the total area, , of rectangles as shown. The width of each rectangle is .
Given that , show that .
Hence deduce the exact value of .
Additional printed Student lecture ask: Construct a similar diagram so that overestimation occurs.
Expand diagramFit diagram to page
Use the scrollbars or arrow keys to inspect details.
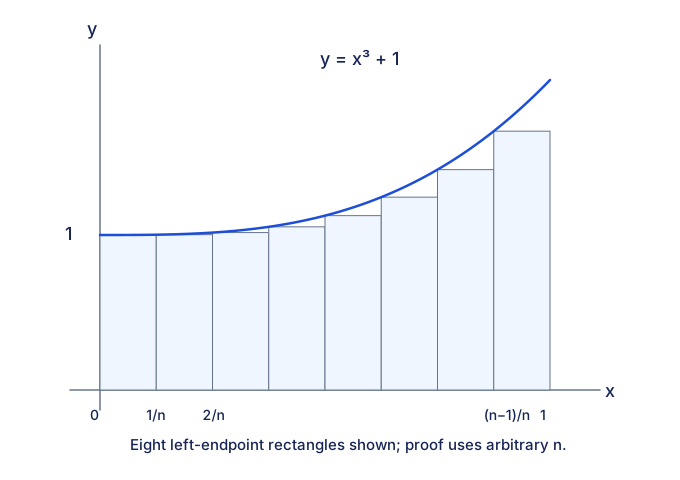
Increasing curve y=x³ +1 on 0≤x≤1. Eight equal-width left rectangles illustrate the source construction for arbitrary n; each width is 1/n, first height 1, last height ((n-1)/n)³ +1. Rectangles lie below the curve, with 0, 1/n, 2/n, (n-1)/n, 1 marked on x-axis. [2008/TPJC/II/5(modified)]
CJC · Discussion · Question 1
- 2
Using partial fractions, find . Give your answer as , with rational .
[2014/II/2]
CJC · Discussion · Question 2
- 3
Find the exact value of such that .
CJC · Discussion · Question 3
- 4
for , and for . Also for all real .
(i) Sketch for .
(ii) Find exactly.
[2015/MJC/I/2]
CJC · Discussion · Question 4
- 5
(a)(i) Find , where .
(ii) Hence evaluate the same integral with upper limit . You may assume as .
(b) The region under between and is rotated through about the x-axis. Use to show that the volume is , and evaluate it exactly.
[2015/IJC/I/10]
CJC · Discussion · Question 5
- 6
For the curve , the region between the curve, , and the x-axis has the same area as the region between the curve, , and the y-axis, where . Find exactly as for integers .
Expand diagramFit diagram to page
Use the scrollbars or arrow keys to inspect details.
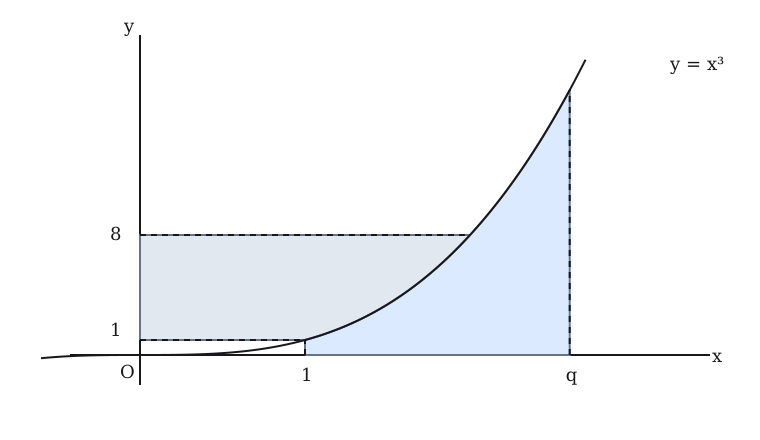
Curve y=x cubed with two shaded areas: below the curve between x=1 and x=q, and to the left of the curve between y=1 and y=8. Dashed boundaries identify x=1, x=q, y=1, y=8; q is to the right of x=2. [2016/MJC/I/2(b)]
CJC · Discussion · Question 6