A hint to get started
Take the limit of left-rectangle areas
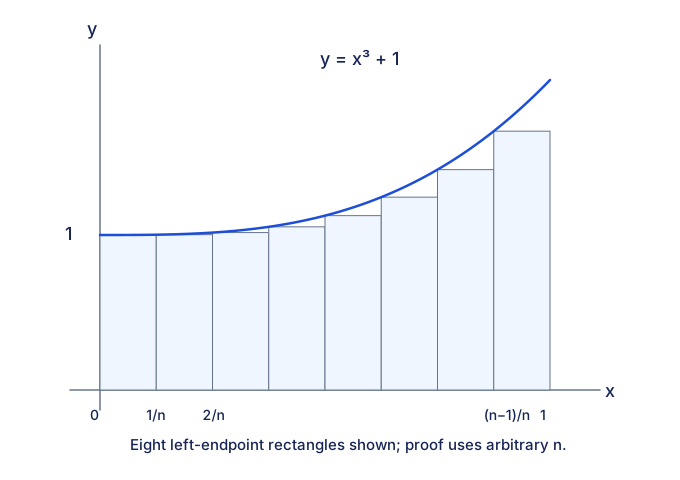
The diagram shows part of the graph of from to . The area under the curve may be approximated by the total area, , of rectangles as shown. The width of each rectangle is .
Given that , show that .
Hence deduce the exact value of .
Additional printed Student lecture ask: Construct a similar diagram so that overestimation occurs.
Expand diagramFit diagram to page
Use the scrollbars or arrow keys to inspect details.
[2008/TPJC/II/5(modified)]
CJC · Discussion · Question 1
Read the rectangle heights from their left endpoints: the last input is (n−1)/n, not 1.
The repeated Student lecture copy adds an overestimation construction; use right endpoints for this increasing curve. The Teacher copy instead asks students to explain the given underestimate.