Worked solution
Recover a function from its gradient and one value
The diagram shows , passing through the origin with turning points and . The x-axis and are its two asymptotes.
(i) Find the range of for which is strictly increasing and concave downwards.
(ii) State the x-coordinates and natures of all stationary points of .
(iii) Given , sketch for , clearly indicating all stationary points, asymptotes and intersections with the axes.
Expand diagramFit diagram to page
Use the scrollbars or arrow keys to inspect details.
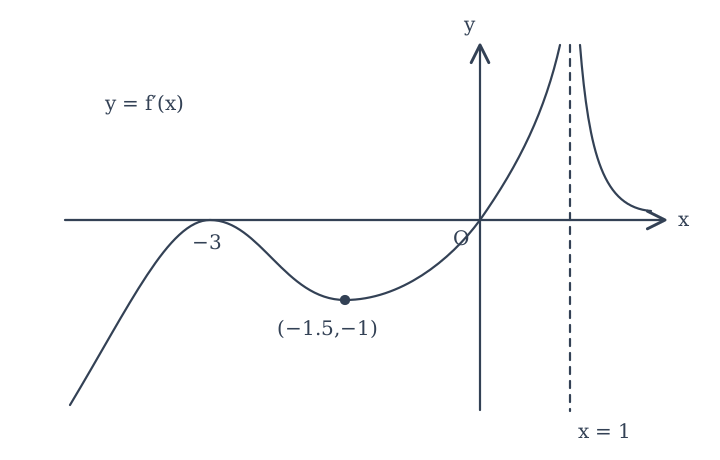
[2009/HCI/I/3]
CJC · Discussion · Question 6
Answer
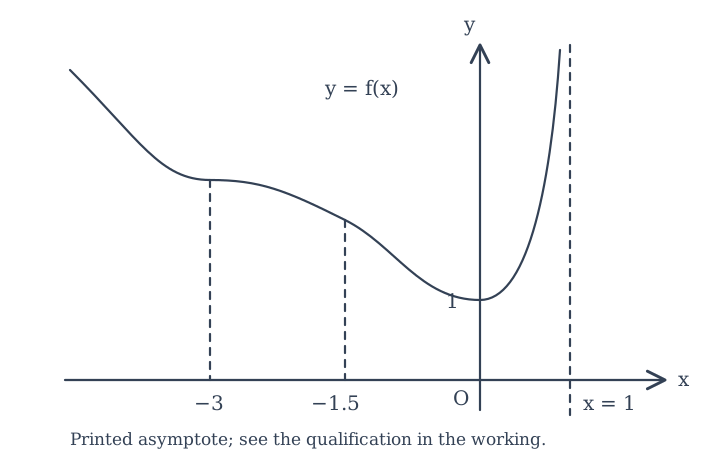
(i) . (ii) Stationary inflection at and minimum . (iii) No x-intercepts for ; the printed sketch additionally shows vertical asymptote , subject to the stated qualification.
(i) Combine two gradient conditions
Strict increase requires ; concavity downwards requires , so must be decreasing. Both conditions hold on the right-hand branch, .
(ii) Classify both stationary points
The zeros of are and .
| x | Sign of f′ before | Sign at x | Sign after | Nature of f |
|---|---|---|---|---|
| −3 | − | 0 | − | Stationary point of inflection |
| 0 | − | 0 | + | Minimum |
At , the derivative touches zero and changes from increasing to decreasing, so changes concavity without turning. At , its gradient changes from negative to positive.
(iii) Position the function and retain the printed sketch
The minimum is , which is the y-intercept. The graph decreases up to this minimum, with a stationary inflection at and another change of concavity at ; it then increases for . It stays at or above for , so has no x-intercepts. The source labels the two negative x-values but does not assign their function values.
The printed answer draws as a vertical asymptote of , with the right-hand end tending to . The SVG retains that printed qualitative sketch.
Distinguish the drawn asymptote from what is forced
The gradient graph alone does not guarantee that diverges at : a derivative can tend to while having a finite improper integral. Thus the vertical asymptote in the printed answer is an additional smooth-shape interpretation; it requires a non-integrable gradient near . The stationary points, sign intervals, y-intercept and absence of x-intercepts above follow directly from the supplied gradient and .
Compare your sketch
Expand diagramFit diagram to page
Use the scrollbars or arrow keys to inspect details.
Common mistakes
An unbounded derivative need not make the function itself unbounded.