A hint to get started
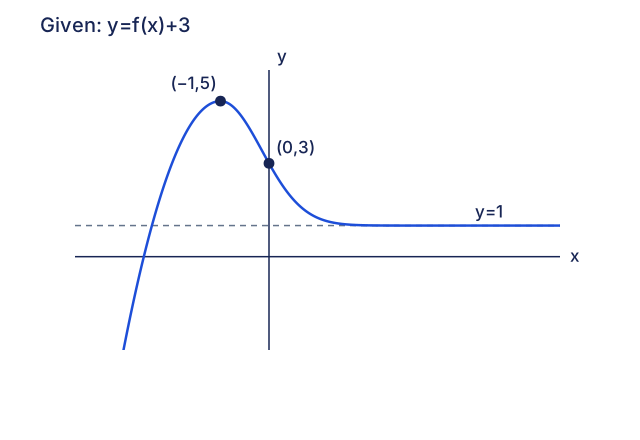
Start from the actual given graph f(x)+3
The supplied graph is , with maximum (−1,5), y-intercept 3 and a right-hand horizontal asymptote y=1.
Sketch on separate diagrams:
(i) ;
(ii) ;
(iii) ;
(iv) .
Clearly indicate asymptotes, turning points and intercepts where possible.
Expand diagramFit diagram to page
Use the scrollbars or arrow keys to inspect details.
CJC · Discussion · Question 2
First recover f itself; the given picture already includes a vertical shift of 3.