Discussion questions · Section 1 of 2
Questions 1–6 in this collection
Keep the order of horizontal translation and scaling · Start from the actual given graph f(x)+3 · +4 more
- 1
Explain how the graph of may be obtained from by appropriate transformations.
CJC · Discussion · Question 1
- 2
The supplied graph is , with maximum (−1,5), y-intercept 3 and a right-hand horizontal asymptote y=1.
Sketch on separate diagrams:
(i) ;
(ii) ;
(iii) ;
(iv) .
Clearly indicate asymptotes, turning points and intercepts where possible.
Expand diagramFit diagram to page
Use the scrollbars or arrow keys to inspect details.
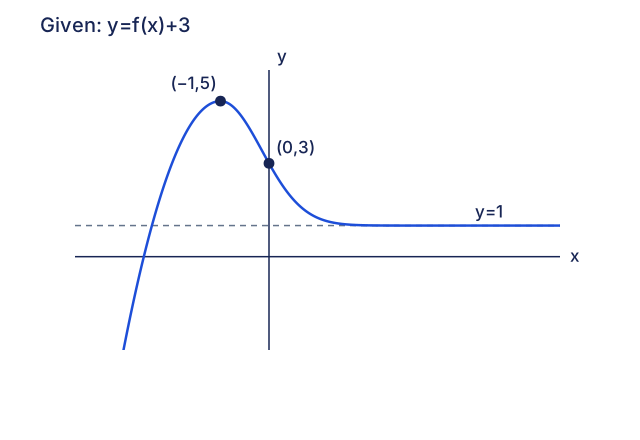
Independent qualitative reconstruction of the supplied graph y=f(x) +3: maximum (-1,5), y intercept (0,3), right-hand horizontal asymptote y=1. Unlabelled crossings and interpolation are schematic; no exact f formula or additional intercept coordinate is inferred. CJC · Discussion · Question 2
- 3
The given graph shows A=(k,1), B=(2k,−2), C=(3k,1), with k>0 as noted in the solution.
Sketch , indicating the coordinates corresponding to A, B, C.
Expand diagramFit diagram to page
Use the scrollbars or arrow keys to inspect details.
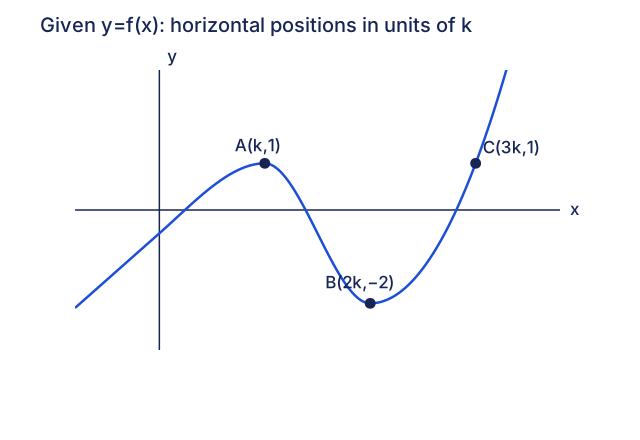
Source qualitative curve with A(k,1), B(2k,-2), C(3k,1), where k>0. Horizontal positions are normalised multiples of the unspecified positive k; no numerical k or extra intercept coordinate is assigned. [2011/MJC/Promo/6(a)]
CJC · Discussion · Question 3
- 4
The original undergoes, in order:
A:translation 4 units in the positive x-direction;
B:reflection in the y-axis;
C:stretch parallel to x by 2.
The resulting equation is . Obtain the original equation.
[2011/SAJC/II/1(b)]
CJC · Discussion · Question 4
- 5
Given , find:
(i) the asymptotes;
(ii) where the curve cuts the axes;
(iii) the stationary point.
Hence sketch F and use it to obtain separate graphs of and .
CJC · Discussion · Question 5
- 6
Given the three supplied graphs of , sketch on separate diagrams.
(a) Zeros x=1,2, y-intercept 2, minimum (3/2,−1/4).
(b) Vertical asymptote x=−1, horizontal asymptote y=−1, y-intercept 1, zero x=1.
(c) Vertical asymptote x=−1, zeros x=±5/2, y-intercept 2, and the oblique guide shown through (0,1), (2,0).
Expand diagramFit diagram to page
Use the scrollbars or arrow keys to inspect details.
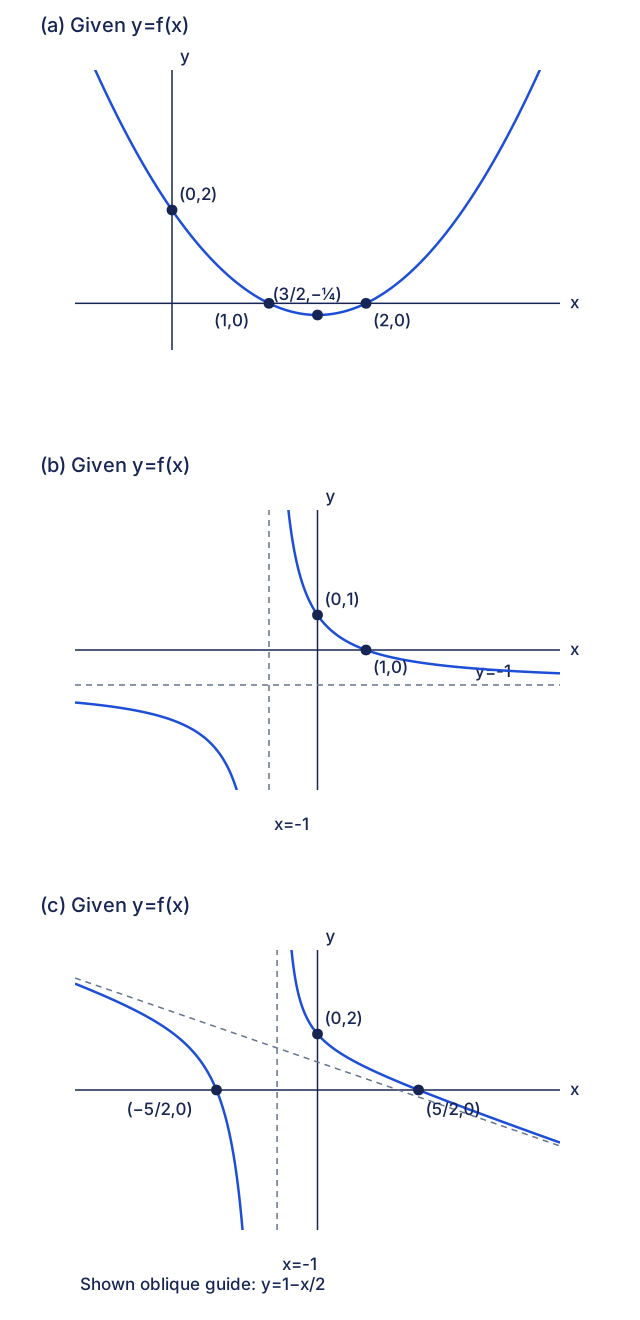
Three qualitative source graph reconstructions, not asserted exact source formulas. (a) zeros 1, 2, y intercept 2, minimum (3/2,-1/4). (b) pole -1, horizontal -1, y intercept 1, zero 1. (c)[2009/VJC/I/7] pole -1, zeros ±5/2, y intercept 2, and the shown oblique guide through (0,1), (2,0). All labelled source features are retained. Part (c): [2009/VJC/I/7]
CJC · Discussion · Question 6