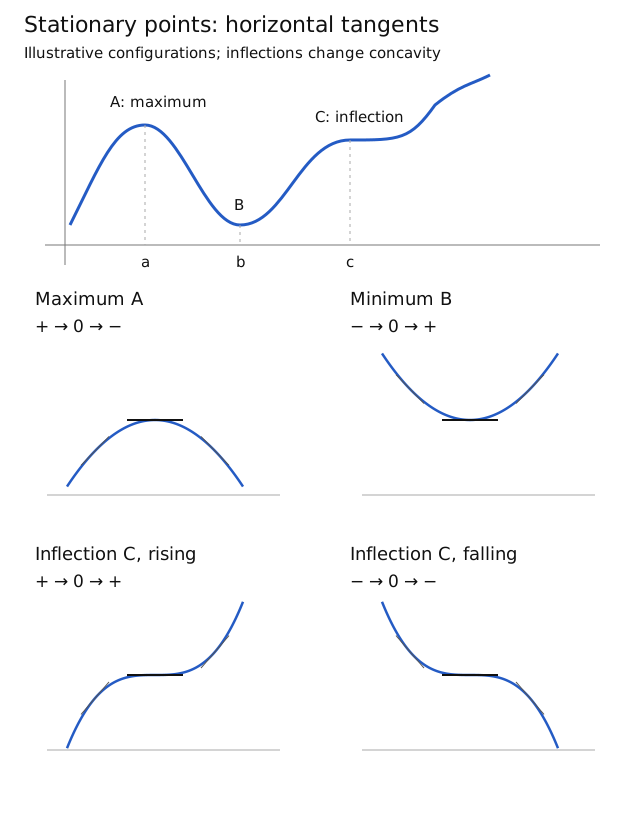
Applications of differentiation · Classify stationary points
Classify a stationary point
Start at an interior input a where f′(a) = 0. Either test can establish a local maximum or minimum; an inconclusive test needs more information.
First-derivative test
Use signs that hold on small intervals on either side of a. Two isolated sample values are not a proof.
- Positive → zero → negativeLocal maximum
The curve rises into the point, then falls. Its value is greater than nearby values.
- Negative → zero → positiveLocal minimum
The curve falls into the point, then rises. Its value is less than nearby values.
- Positive on both sides, or negative on both sidesNo local extremum
There is no turning point. Confirm a change of concavity before calling this a stationary inflection; the same-sign pattern alone does not prove one.
These conclusions are local, not a comparison with the whole graph. If the one-sided signs do not settle, this chart is inconclusive; use another local argument.
Second-derivative test
At the same stationary input, apply the test under the usual local differentiability assumptions. This is an alternative test; you do not have to perform both tests.
- Negative second derivativeLocal maximum
establishes a strict local maximum.
- Positive second derivativeLocal minimum
establishes a strict local minimum.
- Zero or unavailable second derivativeInconclusive
Return to the first-derivative test or another valid local argument. A zero second derivative does not prove an inflection.
The worked comparisons below show three different outcomes with . Predict each outcome before opening its reasoning.
Find the point’s height by substituting a into f, not into a derivative. For an optimisation problem, compare valid candidates with relevant domain boundaries too.
Try a worked example
Read a case, make a prediction, then reveal the reasoning. The examples keep their stated values.
Compare the cubic at zero
For the illustrative function , classify the stationary point at . All three comparisons have : what extra evidence decides this one?
Show reasoning
1. Recognise the inconclusive test
The input is stationary, but a zero second derivative does not classify the point.
2. Check the signs on intervals
For every and every , . The curve is increasing on both sides, so the point is neither a local maximum nor a local minimum. These are interval statements, not just two sampled slopes.
3. Establish the change of concavity
The second derivative is negative to the left and positive to the right of zero. Concavity changes, and , so is a stationary point of inflection. Same-sign first derivatives alone would not establish the concavity change.
Compare the quartic at zero
For the illustrative function , classify the stationary point at . Does force the same outcome as the cubic? Predict the signs of on either side.
Show reasoning
1. Recognise the same inconclusive result
Both derivatives vanish at zero. The second-derivative test supplies no classification.
2. Use the first-derivative sign change
For every , ; for every , . The curve falls into the point and rises away, establishing a strict local minimum at . The height comes from , not from a derivative.
3. Check with the function values
Every nonzero nearby input has . This independently confirms the strict minimum. Also, on both sides: concavity does not change at zero, so this is not an inflection.
Reflect the quartic in the x-axis
For the illustrative function , classify the stationary point at . The second derivative is still zero there. Predict what reflecting the quartic does to its first-derivative signs.
Show reasoning
1. Keep the test's limitation
The negative sign changes the nearby slopes, but both derivatives at zero are still zero.
2. Reverse the sign change
For every , ; for every , . The curve rises into the point and falls away, establishing a strict local maximum at .
3. Check the value and concavity
Every nonzero nearby input has . The second derivative is negative on both sides, so concavity does not change. Across the three comparisons, the same zero second derivative permits an inflection, a minimum or a maximum.
Compare with the curve sketches
Compare the four local configurations below. All four functions are defined for every real x; each plot shows only the stated window. These functions illustrate the source’s four cases, not equations inferred from its combined A/B/C sketch.
Local maximum: rising, then falling
. Inspect around the stationary point .
- Left of the point
On , : rising.
- At the point
. Horizontal tangent .
- Right of the point
On , : falling.
Since , these signs hold throughout the stated intervals. They establish a strict local maximum at . Also . The full cubic is unbounded above, so this is not a whole-graph maximum.
Local minimum: falling, then rising
. Inspect around the stationary point .
- Left of the point
On , : falling.
- At the point
. Horizontal tangent .
- Right of the point
On , : rising.
The factorisation establishes these signs on whole intervals, giving a strict local minimum at . Also . The full cubic is unbounded below, so this is not a whole-graph minimum.
Stationary inflection: rising on both sides
. Inspect around .
- Left of the point
On , .
- At the point
. Horizontal tangent .
- Right of the point
On , .
There is no turning point. To establish an inflection as well, check : it is negative to the left and positive to the right, so concavity changes. The zero value alone is inconclusive.
Stationary inflection: falling on both sides
. Inspect around .
- Left of the point
On , .
- At the point
. Horizontal tangent .
- Right of the point
On , .
The curve keeps falling, so there is no turning point. Here changes from positive to negative, establishing the concavity change. Same-sign first derivatives alone do not prove every function has an inflection.
A local maximum or minimum compares nearby function values. Check relevant domain boundaries separately for optimisation; the displayed window does not establish a whole-graph extremum.
Expand diagramFit diagram to page
Use the scrollbars or arrow keys to inspect details.