Use the scrollbars or arrow keys to inspect details.
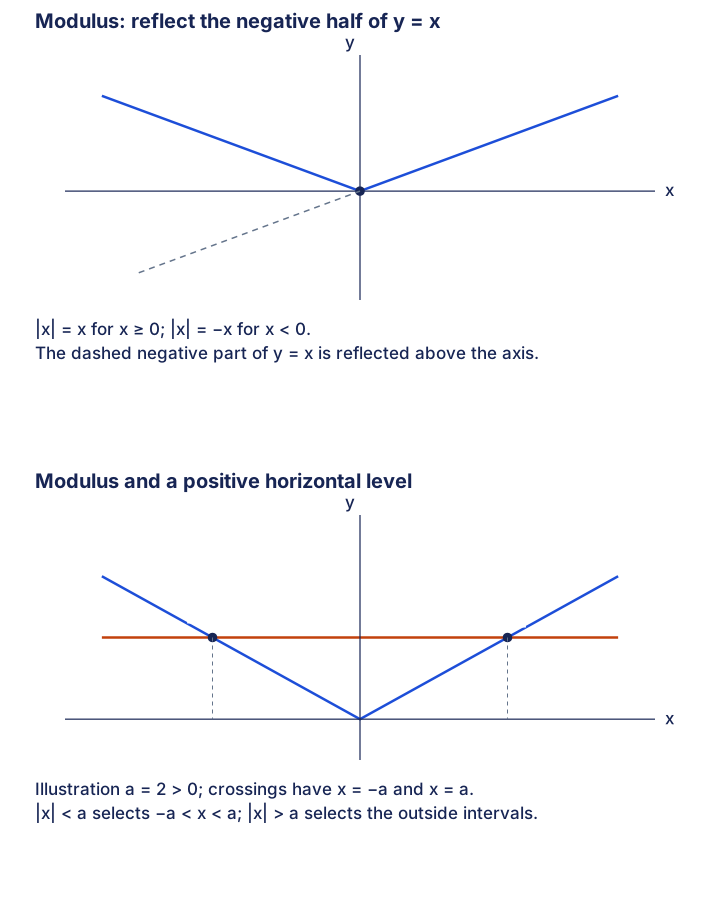
The first source diagram reflects the negative branch of y=x to make the V-shaped graph of|x|. The second compares it with y=a for a>0, retaining both intersections±a and the inside/outside interval distinction. The plotted levela=2 is explicitly illustrative.Open original diagram (new tab)