Original question & working
Map points through three graph transformations · source reference
2010/SRJC/Prelim/II/3 · Question pp. 1 · Working pp. 1, 2
Open the interactive lessonThe working and teaching notes are included in the interactive lesson.
View source review notesFull original question, working & notes
Printed question
The diagram above shows the graph of .
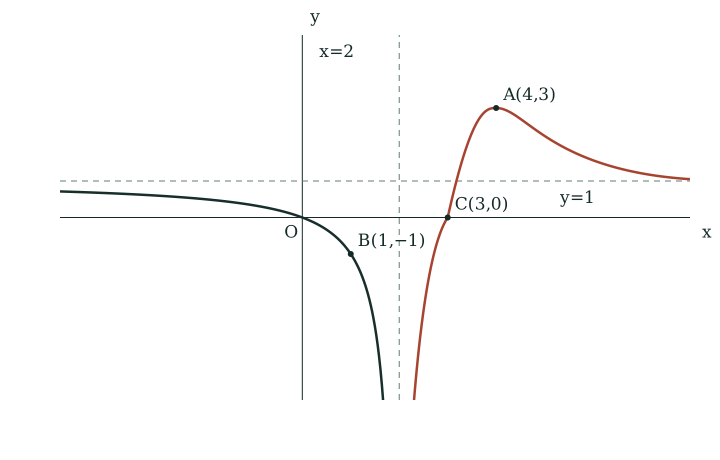
On separate diagrams, sketch the graphs of
(i) , [3]
(ii) , [2]
(iii) . [3]
showing in each case, the coordinates of the points corresponding to and the equations of the asymptotes.
[2010/SRJC/Prelim/II/3]
Printed working
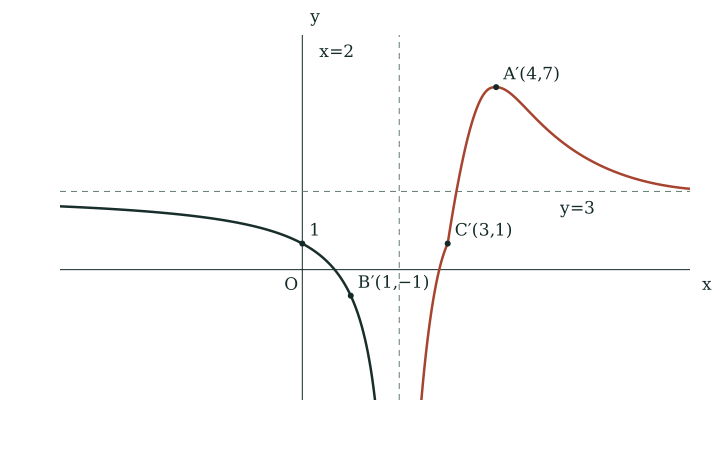
(i) .
.
Scale parallel to -axis by factor of 2; translate by 1 unit in positive -direction.
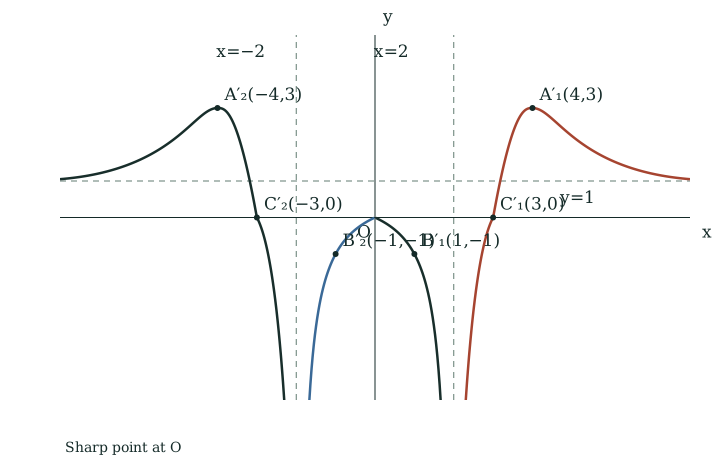
(ii) .
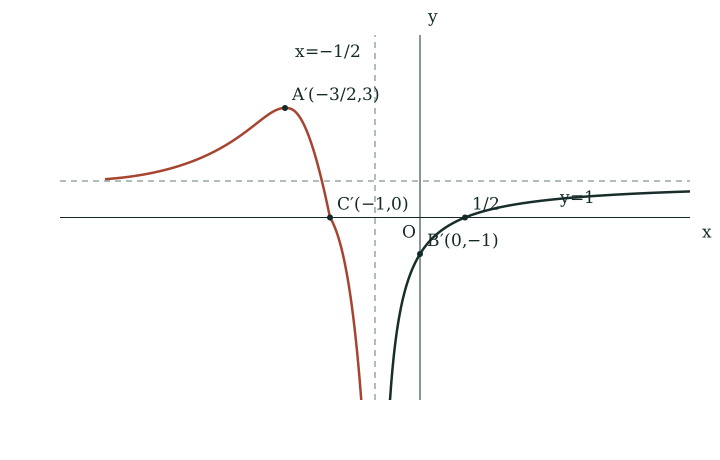
(iii) .
.
Translate 1 unit in negative -direction; scale parallel to -axis by factor ; reflect about the -axis.
Teacher notes
(i) Effect: Multiply -coordinates of all points on graph of by 2, then increase (i.e. add to) the resulting value by 1 unit.
(ii) Sketch of graph of :
- For , retain this part of graph of .
- For , discard this part of graph of and replace it by a reflection of graph in (1) about the -axis.
(iii) Effect: Decrease -coordinates of all points on graph of by 1 unit, then multiply by , and finally change their sign.
Printed answer key
The answer key repeats the native diagrams above with the same coordinates and asymptote labels; no additional algebraic answer is printed.
Editorial qualification
The abbreviated answer-key diagram for (iii) labels the point at the y-axis as B′(0,1), whereas the full worked diagram labels B′(0,−1). Since f(1)=−1, the correct value is −1; the key’s positive sign is preserved here as a printed variant and the native worked graph uses −1.
Source provenance
2025 TJC H2 Math (9758) JC2 MSM: GRAPHS AND CURVE SKETCHING. Question/answer booklet printed pages 1–14; solutions printed pages 1–28. Running metadata and repeated headings are transcribed in the topic metadata article.