Original question & working
Reflect then reciprocate; translate then fold · source reference
modified 2010/ACJC/Prelim/I/3 · Question pp. 2 · Working pp. 6
Open the interactive lessonThe working and teaching notes are included in the interactive lesson.
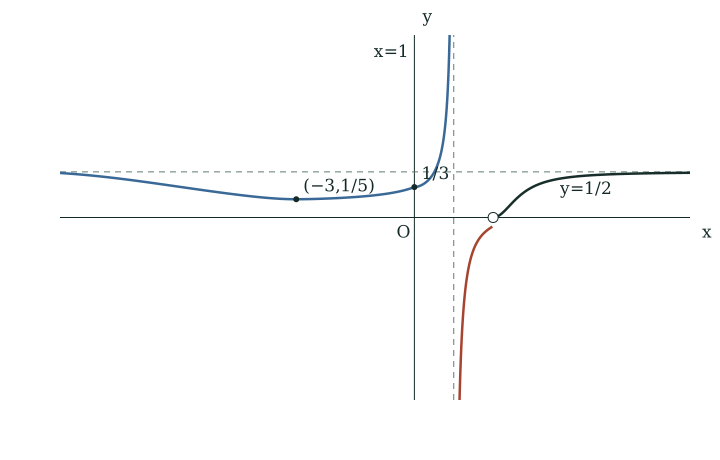
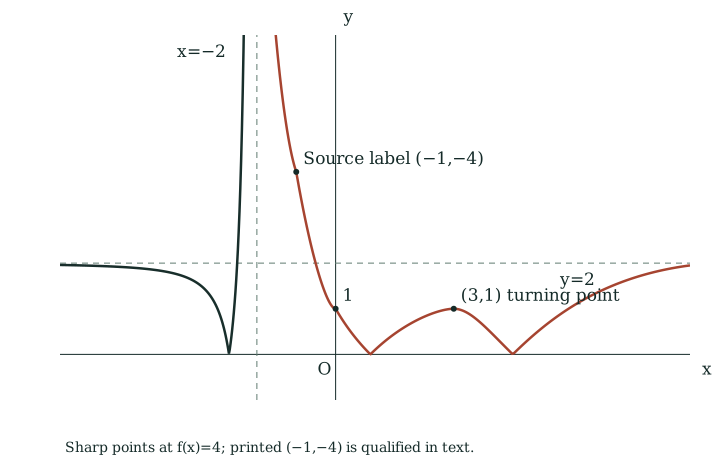
Source solution PDF p.6 labels the reciprocal limit (2,0) as an intercept, although the original input remains excluded; the authored version marks a hole unless a continuous extension is intended. The same page labels the absolute-output image of (−1,0) as (−1,−4); its correct height is |0−4|=4.
Full original question, working & notes
Printed question
The diagram below shows the graph of . The curve cuts the axes at and . It has a maximum point at , and asymptotes and .
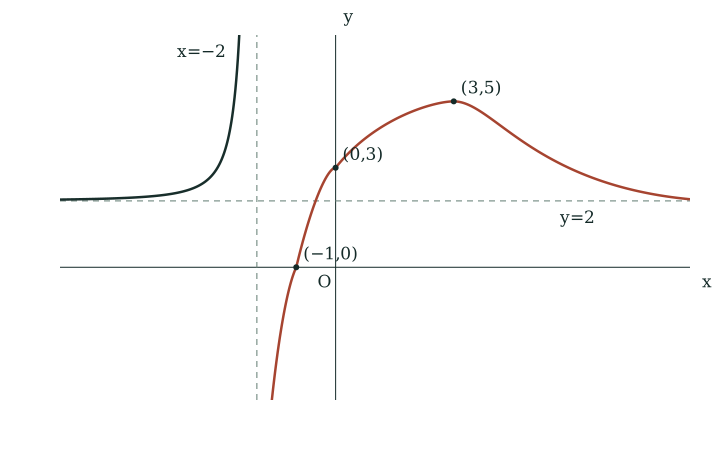
Sketch on separate diagrams, the graphs of
(i) ; [3]
(ii) . [3]
showing clearly asymptotes, intercepts and coordinates of turning points, where available.
[modified 2010/ACJC/Prelim/I/3]
Printed working
(i) (Reflect about -axis; OR vice versa).
(ii) .
Translate by 4 units in negative -direction; reflect the part of curve where above -axis.
Printed comparison table
| Vertical asymptote | -intercept |
| Horizontal asymptote | Horizontal asymptote |
| -intercept | Vertical asymptote |
| Max pt | Min pt |
Printed answer key
The answer key repeats the native diagrams above with the same coordinates and asymptote labels; no additional algebraic answer is printed.
Editorial qualification
The printed reciprocal table calls (-2,0) an x-intercept. It is a limiting hole because f is undefined at -2. After reflection the hole is (2,0). The source transformed modulus sketch labels (-1,-4), but a modulus output cannot be negative: its correct image is (-1,4). Printed labels are preserved in the native diagram as source labels, with this qualification.
Source provenance
2025 TJC H2 Math (9758) JC2 MSM: GRAPHS AND CURVE SKETCHING. Question/answer booklet printed pages 1–14; solutions printed pages 1–28. Running metadata and repeated headings are transcribed in the topic metadata article.