Original question & working
Read a derivative and reciprocal from a shifted graph · source reference
modified 2015/RVHS/Prelim/I/10 · Question pp. 3 · Working pp. 9, 10
Open the interactive lessonThe working and teaching notes are included in the interactive lesson.
Detailed derivative limits follow the supplied qualitative sketch; no exact formula for g or numerical g′(0) is given. Source qualification: solution PDF p.10 labels the reciprocal limit at x=3 as an intercept. Under the original function domain it is a hole; an intercept requires an explicitly defined continuous extension.
Full original question, working & notes
Printed question
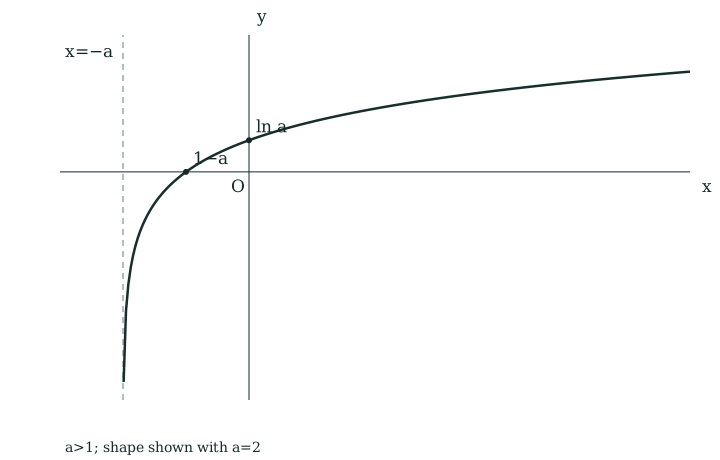
(a) A curve is transformed by a stretch with scale factor 2 parallel to the -axis, followed by a reflection about the -axis. The equation of the resultant curve is , where and . Find and sketch the graph of . [4]
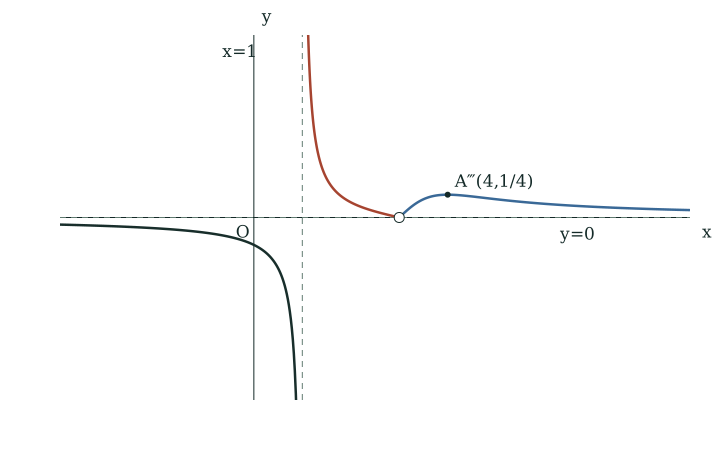
(b) The diagram shows the graph of . The graph passes through the origin and has a turning point . The asymptotes of the graph are and .
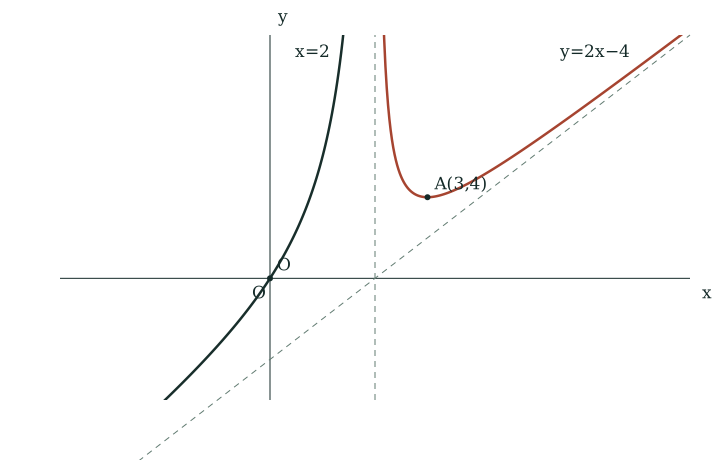
On separate diagram, sketch the following graphs indicating the points corresponding to the axial intercepts, turning point and asymptotes, where necessary.
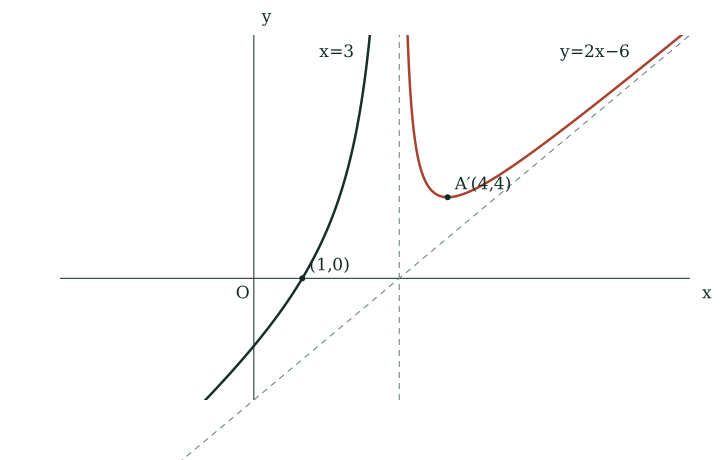
(i) [2]
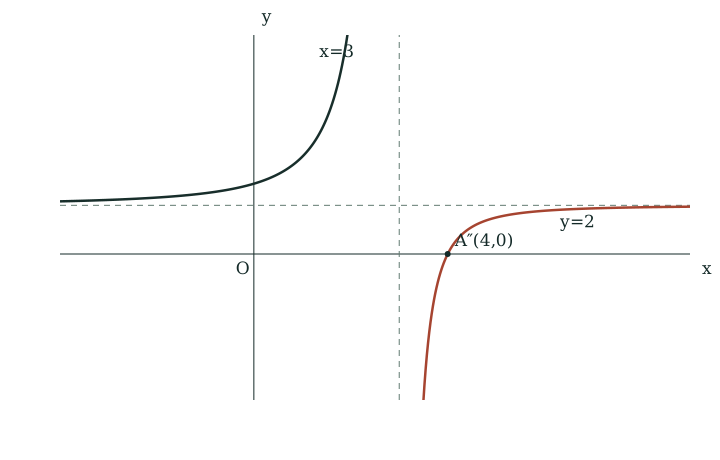
(ii) [3]
(iii) [3]
[modified 2015/RVHS/Prelim/I/10]
Printed working
(a) , where : scale with factor 2 parallel to the -axis; : reflection about the -axis.
Thus .
.
.
Therefore, .
(b)(i) .
(ii) .
(iii) .
Teacher notes
(a) A: Replace by . B: Replace by .
(b)(i) Translate 1 unit in positive -direction.
(b)(ii) 1. Vertical asymptote remains. Oblique asymptote of curve becomes horizontal asymptote of curve .
-
Turning pt of curve becomes -intercept of curve as at stationary pt.
-
Map out the curve by tracing the gradient of curve as increases. As increases from to 3, gradient increases from to ; as increases from 3 to 4, gradient increases from to 0; as increases from 4 to , gradient increases from 0 to .
(b)(iii) 1. Divide original graph into regions where . Note and have the same sign.
-
Take the reciprocal of all -coords on graph of (i.e. ).
-
Identify new intercepts, asymptotes and turning pts.
-
Within each region, complete the graph using the features identified in 2,3.
Printed comparison table
| Vertical asymptote | -intercept |
| Oblique asymptote | Horizontal asymptote |
| -intercept | Vertical asymptote |
| Min pt | Max pt |
| As increases, increases; as increases, decreases | As increases, decreases; as increases, increases |
| () | () |
Printed answer key
The answer key repeats the native diagrams above with the same coordinates and asymptote labels; no additional algebraic answer is printed.
Editorial qualification
The printed reciprocal table calls (3,0) an x-intercept. It is a limiting hole because g is undefined at 3. Differentiation sketch follows the specific source shape; the stated asymptotes alone would not imply derivative asymptotes for every arbitrary differentiable function.
Source provenance
2025 TJC H2 Math (9758) JC2 MSM: GRAPHS AND CURVE SKETCHING. Question/answer booklet printed pages 1–14; solutions printed pages 1–28. Running metadata and repeated headings are transcribed in the topic metadata article.