Original question & working
When can two functions compose? · source reference
[2023/MI/Promo/PU2/I/8] · Question pp. 1 · Working pp. 1, 2, 3
Open the interactive lessonThe working and teaching notes are included in the interactive lesson.
Endpoint checks alone are insufficient: the minimum of g occurs inside its domain.
Full original question, working & notes
Complete question
The functions are for , and for , with real inputs. (i) Sketch y=f(x) and state its range. [2] (ii) Find the inverse of f and its domain. [2] (iii) Show that fg exists. [2] (iv) Find fg(x) and its range. [3] (v) With g now defined on all real numbers, describe fully a sequence of transformations taking y=g(x) to . [3]
[2023/MI/Promo/PU2/I/8]
Printed working
Part (i)
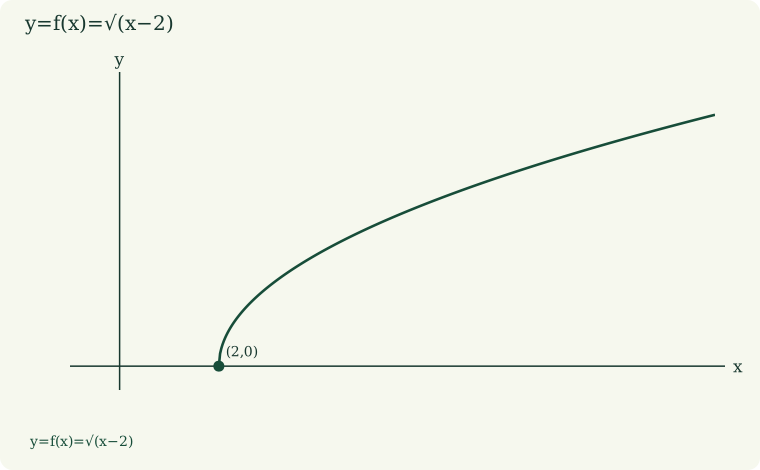
From the square-root graph beginning at the closed point , .
Part (ii)
The printed line says “where (Note: )”. The inverse input in this rearrangement is ; the final domain below supplies that restriction.
Part (iii)
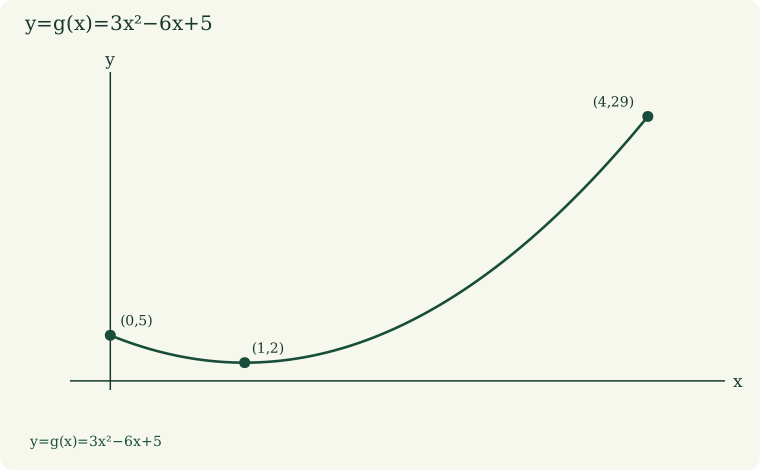
Thus exists. The graph of labels , minimum and closed endpoint . The original nested interval diagram places the bounded interval inside the rightward ray, with labels 2 and 29.
Part (iv)
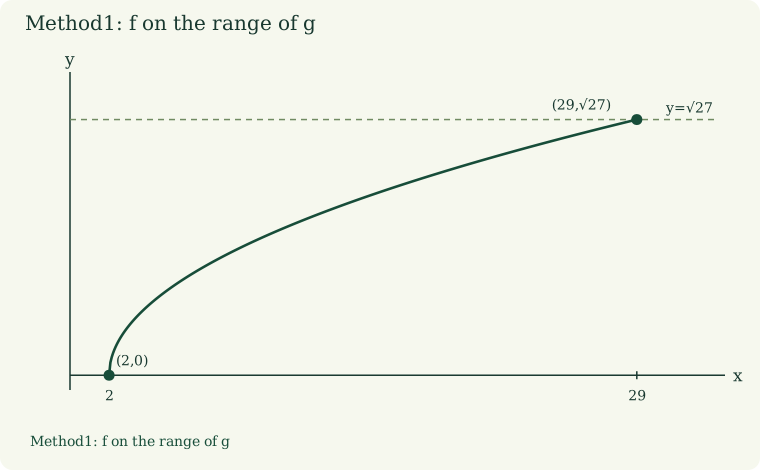
Method 1: , with domains/ranges labelled , , . Sketch for . The graph labels closed points and and the level . Therefore .
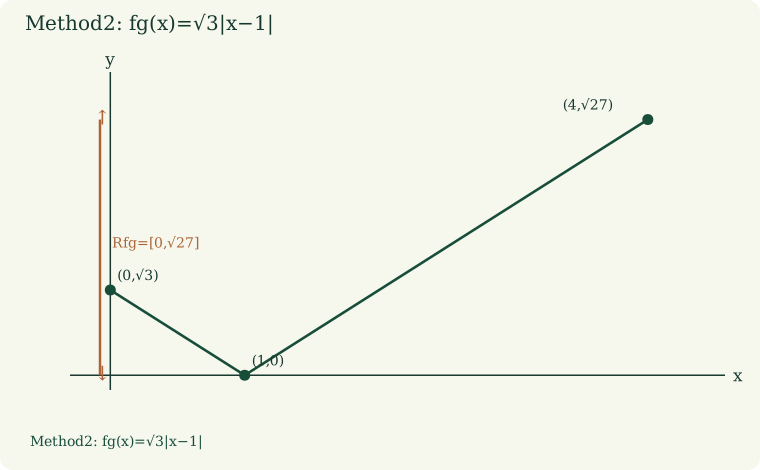
Method 2: Sketch , . The V has vertex and closed endpoint ; a vertical double-headed arrow labels . Thus again.
Part (v): three printed transformation methods
Let .
Method 1:
- Replace by : . Translate in the negative x-direction by 1 unit.
- Replace by : , so . Translate in the negative y-direction by 5 units.
- Replace by : . Scale parallel to the y-axis by scale factor .
Method 2:
- Replace by : . Translate in the negative x-direction by 1 unit.
- Replace by : . Scale parallel to the y-axis by scale factor .
- Replace by : . Translate in the negative y-direction by units.
Method 3:
- Replace by : . Translate in the negative x-direction by 1 unit.
- Replace by : . Scale parallel to the x-axis by scale factor .
- Replace by : . Translate in the negative y-direction by 3 units.
Teacher margin notes
To find the range of , sketch the graph of and, from the graph, find the range of y-values.
. Make the subject where . Then replace by to find .
Note that the range of is from the y-value of the minimum point to the y-value of the endpoint . Do not just consider the y-values of the two endpoints to find the range of .
Treat as the new domain for the graph of to find .
Source diagrams
![Original range/domain inclusion and mapping flow: Rg=[2,29] inside Df=[2,∞), and[0,4] through g then f.](/diagrams/native-04-01-range.svg)
Review qualification
Endpoint checks alone are insufficient: the minimum of g occurs inside its domain.
The corrected or qualified authored derivation is retained in the question article.
Provenance
Question page references: 1. Solution page references: 1, 2, 3. The original compilation header and printed page numbers are preserved in the edition notes. Original PDFs and page images remain only in the private QA archive.