Original question & working
Compare a left-endpoint sum with the integral · source reference
2025 TJC H2 Maths (9758) JC2 MSM · original exercise attribution retained on source pages · Question pp. 7 · Working pp. 19
Open the interactive lessonThe working and teaching notes are included in the interactive lesson.
View source review notesFull original question, working & notes
Printed question
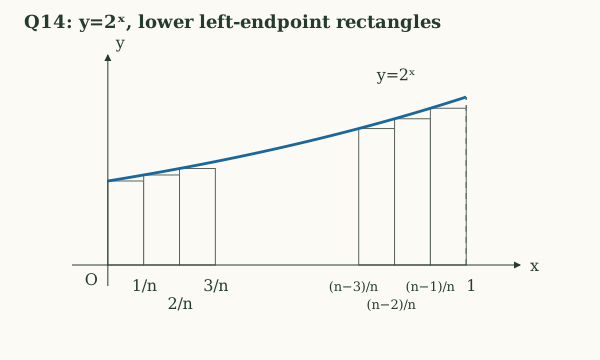
The graph , , is shown. Rectangles, each width , where is an integer, are drawn under the curve. Show their total area is . [2]
By considering the area bounded by , and the axes, briefly explain why . [3]
[2008/NJC/Prelim/I/3]
Printed working
All rectangles lie below the curve. Total area of rectangles area under curve on :
Hence (shown).
Teacher notes
The source diagram labels O, , . Lower rectangles use left-end heights, with a middle gap indicating continuation. Native rendering retains all symbolic labels.
Printed answer key
No separate short-key entry is printed for Q14; its two “shown” results are supplied in the detailed solution.
Source diagrams in native form