Original question & working
A declining species and an increasing logistic species · source reference
[2021/TJC/Prelim/I/10] · Question pp. 6 · Working pp. 23, 24, 25, 26
Open the interactive lessonThe working and teaching notes are included in the interactive lesson.
View source review notesFull original question, working & notes
Printed question
On a mangrove swamp, scientists are investigating the population of mudskippers and crabs. Initially, there are 800 mudskippers and 800 crabs on the mangrove swamp. At time years, the number of mudskippers and crabs are respectively.
(a) For the mudskippers, the scientists discovers that every year, the growth rate is 0.4% of the population size and the death rate is 5 mudskippers per year.
(i) Write down a differential equation relating . [1]
(ii) Solve the differential equation in part (i) and determine what happens to the mudskipper population in the future. [4]
(b) For the crabs, the scientists propose that are related by the differential equation .
(i) Find the number of crabs in the mangrove swamp when the rate of change of is a maximum. [2]
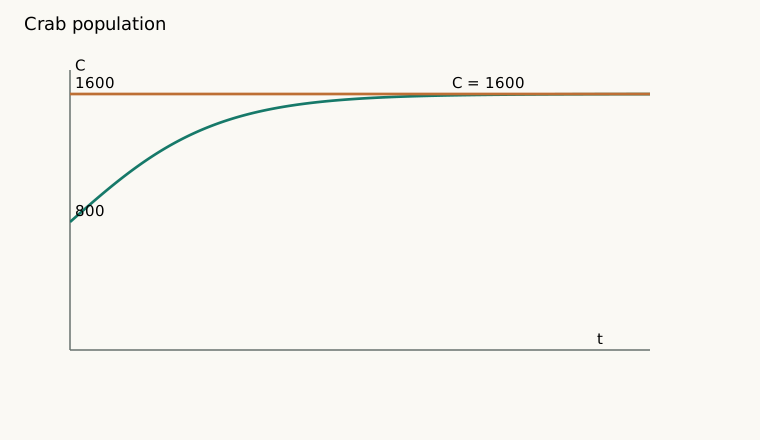
(ii) Find in terms of . Sketch a graph of against . [5]
[2021/TJC/Prelim/I/10]
Printed working
Mudskippers (a)
Growth rate ; death rate 5. .
; ; .
; , .
At 0, , ; .
As , this formal expression tends to ; the population becomes extinct. : extinction in the 256th year; physical model stops at zero.
Crabs maximum growth (b)(i): three printed methods
- . . , so maximum.
- Complete square: . Maximum when .
- at . The downward quadratic attains its maximum at the midpoint 800; graph vertex .
Crabs solution (b)(ii): printed partial-fraction method
; .
.
; .
, .
At 0, , ; .
Printed complete-square method
; .
.
; at 0, .
.
As , so .
Printed answer key
(a)(i) . (ii) ; Mudskipper population will become extinct in the future. (b)(i) 800. (ii) ; native sketch below.
Teacher note 1
is the overall net change in the number of mudskippers .
Teacher note 2
Given , . Integrate .
Need to put in the modulus sign when integration results in a logarithm, since its argument may be negative. In removing the modulus sign, remember to put in “”. Here may be negative.
Teacher note 3
Complete the square: , so and .
Teacher note 4
Since coefficient of is negative, this quadratic curve has a maximum. For a quadratic, max/min occurs at the midpoint of the -intercepts.
Teacher note 5
; . At , ; at , . Cover-up rule gives the same values.
Need to put in the modulus sign when integration results in a logarithm, since its argument may be negative. In removing the modulus sign, remember to put in “”.
Teacher note 6
As , , so .
Diagram 10-16-growth
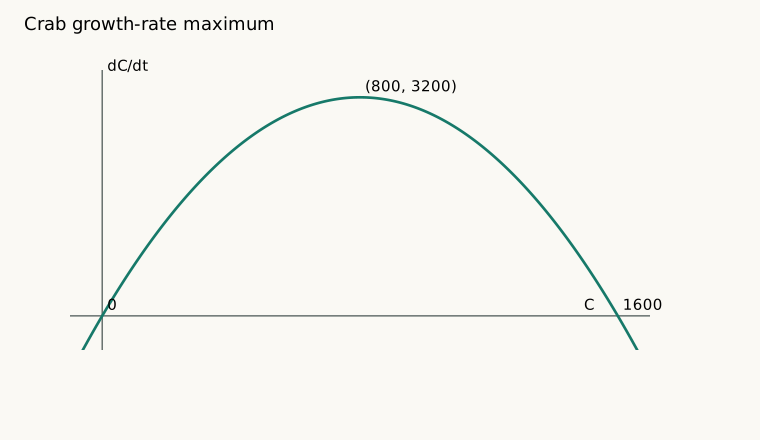
Diagram 10-16-population
Mathematical review
(a)(i) . (ii) ; initial M=800 gives . It reaches zero at years. Interpret this as modeled extinction and stop the population model there.
(b)(i) , maximal at C=800, with rate 3200/year. (ii) Separation of gives . Initial C=800 gives A=0, so . It starts at the logistic inflection (0,800), is increasing and concave down for t>0, and approaches C=1600. Substitution into the DE and both initial conditions verifies the formulas.
Provenance
TJC JC2 2025 H2 Maths (9758) MSM. Native transcription checked against original visible question, working and sidebars. Question page(s): 6. Working page(s): 23, 24, 25, 26. Original records remain private for QA; this native article has no PDF or raster worksheet dependency.