Original question & working
Logistic proportions and the first whole week · source reference
[2021/HCI/Prelim/I/10] · Question pp. 7 · Working pp. 29, 30, 31, 32, 33
Open the interactive lessonThe working and teaching notes are included in the interactive lesson.
View source review notesFull original question, working & notes
Printed question
A flu virus is spreading in a community which has a fixed population of people. Scientists discover that at time weeks from the beginning, the rate of change of the number of people who are infected is proportional to the product of the number of people infected, , and the number of people who are not infected.
(i) Write down a differential equation relating . [1]
It is noted that at the beginning, 1% of the people in the community is infected with the virus. 12 weeks later, the proportion of people infected in the community has risen to 25%.
(ii) By solving the differential equation obtained in part (i), show that . [6]
(iii) Find the least number of weeks needed for the proportion of people infected to exceed 50%, giving your answer to the nearest integer. [2]
(iv) Sketch the graph of against . Explain, with justification, what happens to the number of people infected if this situation continues indefinitely. [2]
(v) State a possible limitation of the model in part (i). [1]
[2021/HCI/Prelim/I/10]
Printed working
.
Method 1: partial fractions
.
().
; ; , .
; ; .
At 0, : .
At 12, : .
.
Method 2: MF27 / complete the square
.
.
The printed solution repeats the exponentiation, initial conditions , calibration , and final formula above, giving the same result.
Threshold method 1: algebra
.
.
. Least whole number of weeks: 16.
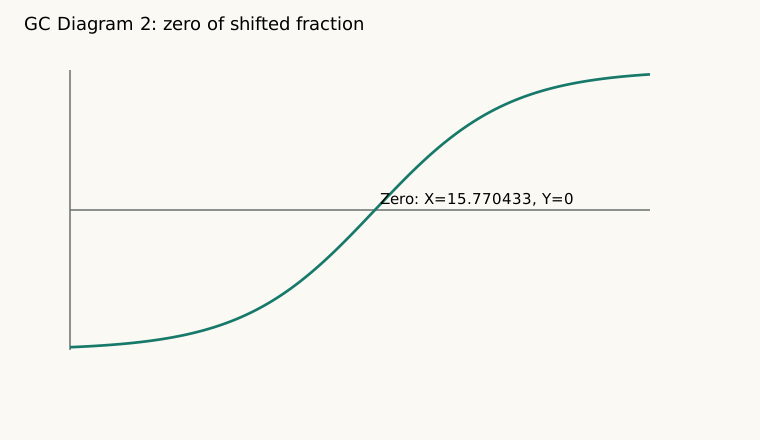
Threshold method 2: graphical calculator
The original calculator figures display mode NORMAL FLOAT AUTO REAL RADIAN MP. Diagram 1 displays CALC INTERSECT, and Diagram 2 displays CALC ZERO; their intersection/zero readouts are recreated in the native figures.
Plot with , or plot and locate its zero. Both give threshold , so rounded and whole week 16.
As , . Almost everyone in the community will be infected if this continues indefinitely.
Limitations printed: the model assumes everyone will get the virus, but some may have natural immunity; or, deaths may occur during some weeks so is no longer constant.
Printed answer key
(i) . (iii) 16. (iv) Native sketch below. If this situation continues indefinitely, almost everyone in the community will be infected by the virus. (v) One possible limitation is that the model assumes everyone will get the virus which in actual fact some may have natural immunity against the flu virus.
Teacher note 1
Given , . Let ; . At , ; at , . Hence .
Teacher note 2
Complete the square for , where are constants.
Teacher note 3
For Diagram 1, sketch and . On GC go to 2nd [calc] → 5:intersect to find intersection between the 2 curves.
For Diagram 2, sketch . On GC go to 2nd [calc] → 2:zero to find intersection of curve and horizontal axis.
Diagram 10-18-population
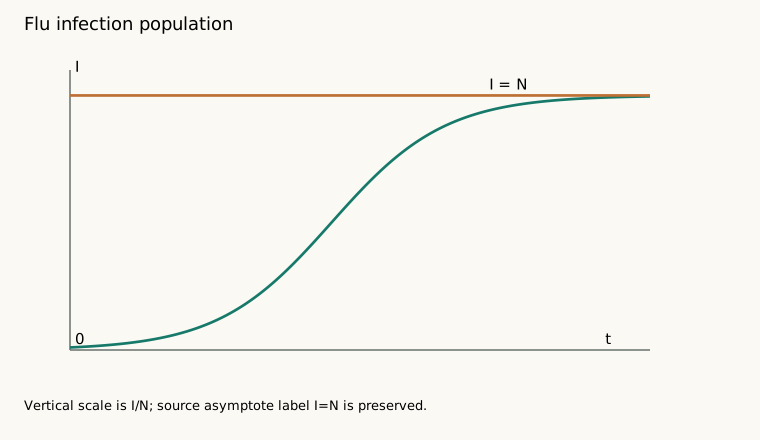
Diagram 10-18-GC-intersection
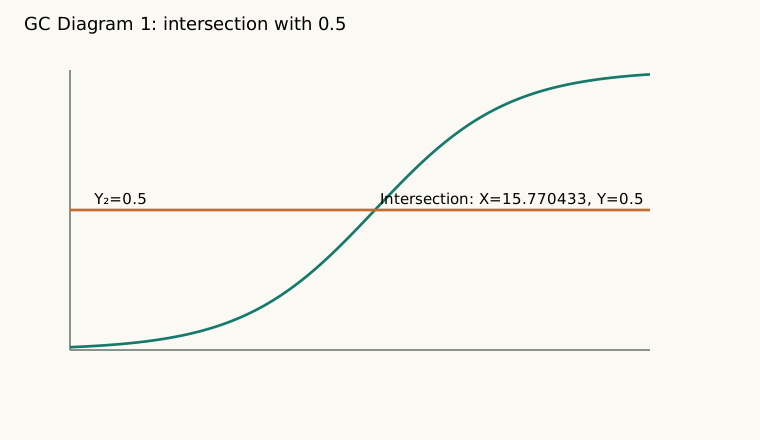
Diagram 10-18-GC-zero
Mathematical review
(i) , k>0.
(ii) Separating gives . At t=0 the odds are 1/99. At t=12 they are 1/3, so and . Thus .
(iii) requires , hence . The nearest integer and first complete integer week are both 16.
(iv) I begins at 0.01N, increases sigmoidally, has an inflection at I=N/2 and approaches the asymptote I=N. (v) The model assumes no recovery or immunity and a fixed total population. Either assumption can fail in an actual epidemic; its mathematical limiting behavior is conditional on these assumptions.
Provenance
TJC JC2 2025 H2 Maths (9758) MSM. Native transcription checked against original visible question, working and sidebars. Question page(s): 7. Working page(s): 29, 30, 31, 32, 33. Original records remain private for QA; this native article has no PDF or raster worksheet dependency.