Absolute input discards the left-hand features
The diagram shows the graph of . The curve passes through the origin , the points and . The points and are stationary points and the lines and are asymptotes of the curve.
Sketch on separate clearly labelled diagrams, the graphs of
(i) ; marks
(ii) ; marks
(iii) , marks
indicating clearly the points corresponding to , and the asymptotes, where applicable.
[modified 2010/RVHS/Prelim/II/1]
Solution
Reflection and translation
Sketch the graph of , indicating clearly the points corresponding to , , , and the asymptotes.
Hint
Write as : first negate, then add 1.
Apply both operations to every -coordinate and to horizontal asymptotes.
Vertical asymptotes and -coordinates do not move.
is not . Negate first, then add 1, so that the asymptote lands on .
Nothing in changes , so stays exactly where it was.
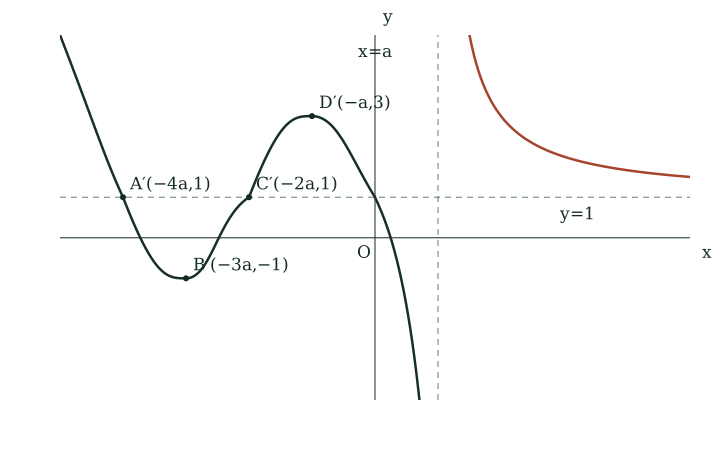
Answer · (i)
; asymptotes .
Reflect in the -axis
Every -coordinate changes sign: , . and lie on the axis and stay put. The asymptote is unchanged.
Translate up by 1
Add 1 to every -coordinate: , , , . The horizontal asymptote moves to . The vertical asymptote stays.
Explore the idea
Modulus of input and output
Sketch the graph of , indicating clearly the points corresponding to , , , and the asymptotes, where applicable.
Hint
Do the inside first: keeps and mirrors it.
Then take the modulus of the output: anything below the -axis flips up.
Ask which of , , , even survive.
They all have , so ignores them. The sketch contains no points labelled to .
has two different jobs: discards the left half and mirrors the right; the outer modulus reflects negative heights upwards. These two folds commute, but neither is the same as reflecting the whole graph.
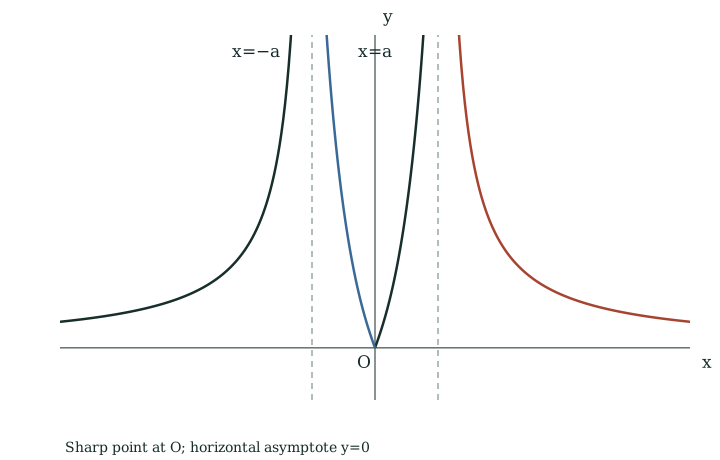
Answer · (ii)
Even, nonnegative graph through ; asymptotes .
No images of the negative-input points A,B,C,D survive; cusp at O.
Replace by
The left-hand part of the graph, including , , and (all at negative ), is discarded. The part with is kept and reflected in the -axis. Asymptotes appear, and stays.
Take the modulus of the output
Any part below the -axis is reflected above it, so the graph is never negative. The graph passes through with a sharp point (cusp), since the two halves meet there.
What survives?
None of , , , has an image: they were all on the discarded side. Only and the asymptotes , matter.
Explore the idea
Reciprocal graphs
Sketch the graph of , indicating clearly the points corresponding to and and the asymptotes.
Hint
Zeros of become vertical asymptotes of . Which -values are those?
Turning points stay at the same but their heights invert: and , and max/min swap.
The old vertical asymptote becomes a (missing) zero.
is undefined at , so is too. The curve approaches but never reaches it: draw an open circle.
On any interval where , a maximum of corresponds to a minimum of .
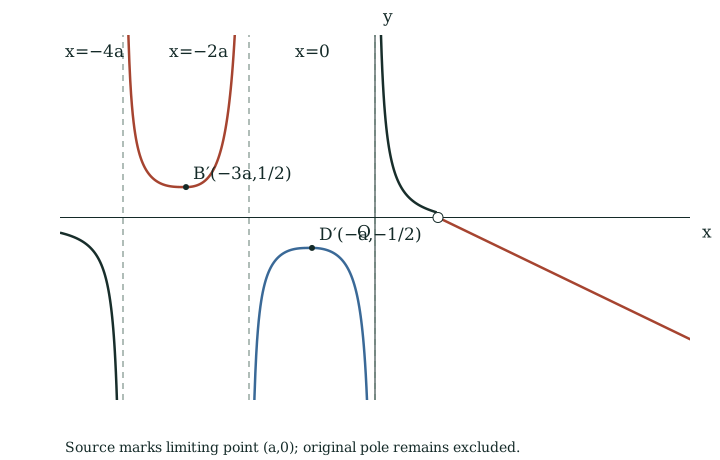
Answer · (iii)
; poles ; hole .
The old pole is excluded, not a new intercept; y=0 is a left-end asymptote.
Zeros become asymptotes
Dividing 1 by a number close to zero gives a huge value, positive or negative depending on the sign of .
Turning points invert
On each interval where is nonzero, taking reciprocals reverses order: an increasing branch becomes decreasing and vice versa. A maximum becomes a minimum, and a minimum becomes a maximum. This holds for negative as well as positive heights.
Old asymptotes
The vertical asymptote becomes a point where the new graph meets the -axis, but is not defined there, so we mark an open circle at . The old horizontal asymptote makes unbounded as .
Signs are preserved
and have the same sign everywhere, so each branch of the new graph stays on the same side of the -axis as the old one.
Explore the idea