Worked solution
Fit a price adjustment to the shortage between two curves
The given diagram has quantity tonnes on the horizontal axis and price dollars per kg on the vertical axis. Consumer curve and producer line meet at . Consumer quantity is inversely proportional to price, while producer quantity is directly proportional to price.
(i) Interpret in context.
(ii) Find both equations, expressing in terms of .
A shortage occurs when consumer quantity exceeds producer quantity. The rate of increase of price after months is proportional to this shortage.
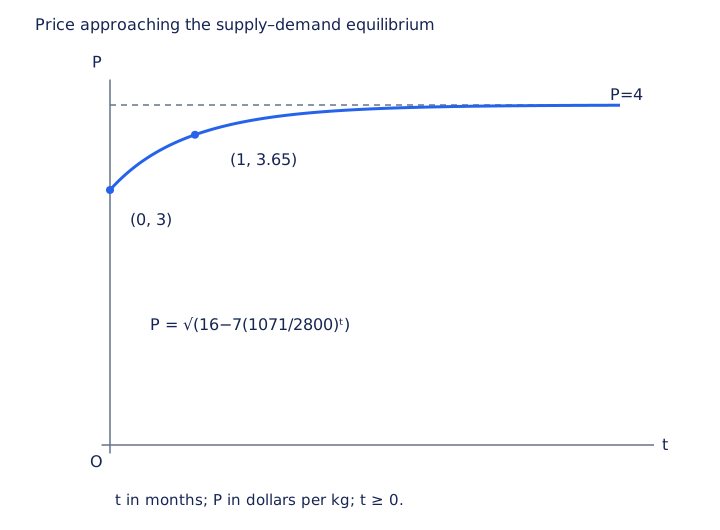
(iii) Given an initial price of $3 and a price of $3.65 after one month, find and sketch it, showing its long-term behaviour. Suggest why producers might use , , instead of .
Expand diagramFit diagram to page
Use the scrollbars or arrow keys to inspect details.
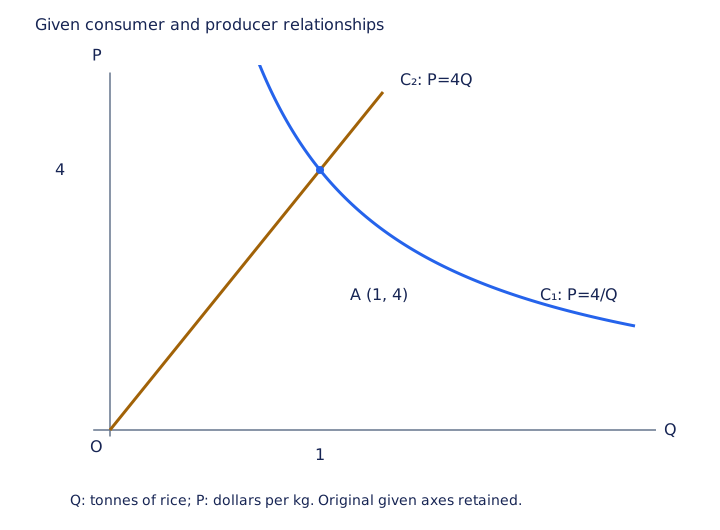
[2017/NJC/I/10(b)]
CJC · Review problems · Question 10
Answer
, ; dollars per kg.
(i) Interpret both coordinates with their units
At a price of $4 per kg, producers supply tonne of rice and consumers buy all of it. Supply and demand match: this is the equilibrium point.
(ii) Calibrate the two proportionality laws
and . Using , gives , . Thus consumer quantity is and producer quantity is .
(iii) Derive the price equation from the shortage
For the observed prices below equilibrium, shortage is . Thus , . Separating gives , hence . Therefore , where . Take the positive price root .
(iii) Use both price observations before rounding
gives . Then gives and . The exact fitted expression is for . The source’s rounded display is retained as an approximation; the square root, visible in the source, is lost by native extraction.
(iii) Sketch the adjustment and interpret the alternative producer law
The price curve starts at , passes through , increases with decreasing slope, and approaches dollars per kg from below. For , a positive intercept can represent a minimum price needed to cover fixed initial investment costs; the source notes that production requires the price to cover those costs. Direct proportionality alone puts the producer line through the origin.
Compare your sketch
Expand diagramFit diagram to page
Use the scrollbars or arrow keys to inspect details.
Common mistakes
Keep the positive square root and fit the second observation before rounding the exponential rate.