A hint to get started
Fit a price adjustment to the shortage between two curves
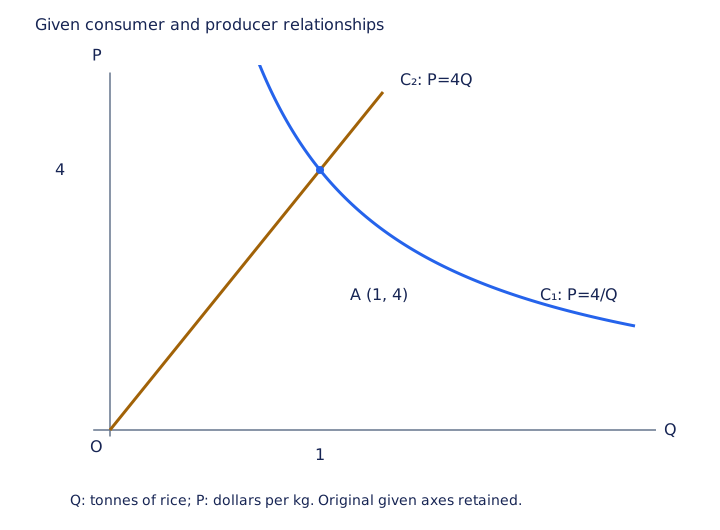
The given diagram has quantity tonnes on the horizontal axis and price dollars per kg on the vertical axis. Consumer curve and producer line meet at . Consumer quantity is inversely proportional to price, while producer quantity is directly proportional to price.
(i) Interpret in context.
(ii) Find both equations, expressing in terms of .
A shortage occurs when consumer quantity exceeds producer quantity. The rate of increase of price after months is proportional to this shortage.
(iii) Given an initial price of $3 and a price of $3.65 after one month, find and sketch it, showing its long-term behaviour. Suggest why producers might use , , instead of .
Expand diagramFit diagram to page
Use the scrollbars or arrow keys to inspect details.
[2017/NJC/I/10(b)]
CJC · Review problems · Question 10
Model the difference between demand and supply before separating the price equation.