Unit 10 of 12 · Sequences and series
Model and analyse recurrences
Generate terms, unfold a recurrence and separate candidate limits from justified behaviour.
Generate a recurrence before justifying its behaviour
Example 30 models geese on a poultry farm, allowing for influences such as sales and deaths, by . Here is the initial population, so the calculator setup uses nMin=0, u(n+1)=0.75u(n)+80 and either u(0)=576 or u(0)=320. The requested first four updates are:
| n | u₀=576 | u₀=320 |
|---|---|---|
| 0 | 576 | 320 |
| 1 | 512 | 320 |
| 2 | 464 | 320 |
| 3 | 428 | 320 |
| 4 | 401 | 320 |
The source screens continue with these displayed values:
| n | First calculator table | Second calculator table |
|---|---|---|
| 5 | 380.75 | 320 |
| 6 | 365.56 | 320 |
| 7 | 354.17 | 320 |
| 8 | 345.63 | 320 |
| 9 | 339.22 | 320 |
| 10 | 334.42 | 320 |
Later screen values are rounded displays of the real-valued model; retain unrounded intermediate values when calculating. The lecturer explicitly stresses “appears to be”: these first five values suggest a decreasing sequence in the first case and a constant sequence in the second. A short table alone does not justify behaviour for every index.
Unfold the same recurrence backwards or forwards
The source gives two derivations for Example 30. Starting from , repeatedly replace the preceding term:
Continuing for updates gives plus times a GP with first term 1, ratio 0.75 and terms. Starting instead from , expand successive updates:
The same constant contributions now appear in descending powers. Both methods reach
The finite sum here is for ; the closed formula also gives at . Since , .
For , the distance above 320 is and strictly decreases; indeed .
For , the coefficient of the power is zero, so for every integer .
This formula justifies the earlier observations, as the second lecturer note requests.
A stray beneath the Student general derivation belongs only to the constant initial case; it is not true for every initial population.
Fit an explicit form and sum its three components
Example 31 is self-reading. The recurrence and values give
The Student copy explicitly supplies the update. Fit the given form with those three values:
The source uses a calculator simultaneous-equation solver, obtaining . Subtracting consecutive equations also gives , and hence , which confirms the result.
For the sum, separate the geometric, arithmetic and constant pieces:
Each group contains terms. The geometric powers start at 2 and have ratio 2; the natural numbers start at 1 and have difference 1.
The source labels say GP first term 1 and AP difference 2, but its following calculation uses the correct values.
The Teacher asks for the answer in terms of ; the Student prints “in terms of ”, although is already fixed at 5. Follow the Teacher’s variable and the worked answer; no further simplification is required.
Separate possible limits from observed convergence
Example 32 uses the graph of . It has a positive intercept , two positive roots , and one minimum. It is negative between the crossings and positive outside them.
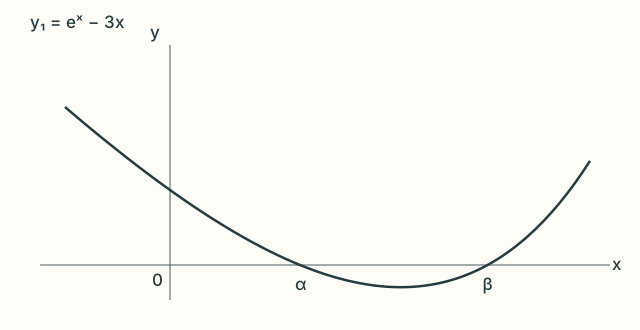
The calculator gives and to three decimal places. Keep more digits when iterating or comparing values near a root. For the recurrence , part (ii) assumes convergence. If , the shifted sequence also tends to , and continuity gives
The source callout specifically explains this conditional instruction. The calculation identifies possible finite limits; it does not prove that every starting value converges. Retain the hypothesis in the concluding sentence.
For part (iii), the source calculator table displays:
| Term | Start 0 | Start 1 | Start 2 |
|---|---|---|---|
| x₁ | 0 | 1 | 2 |
| x₂ | 0.333 | 0.906 | 2.463 |
| x₃ | 0.465 | 0.825 | 3.913 |
| x₄ | 0.531 | 0.761 | 16.69 |
| … | … | … | … |
| x₁₅ | 0.619 | — | — |
| x₁₆ | 0.619 | — | — |
| x₁₇ | 0.619 | 0.619 | — |
| x₁₈ | — | 0.619 | — |
| x₁₉ | — | 0.619 | — |
A dash represents a blank cell in the source, not a zero or a failed calculation. Iterate unrounded values; repeated displayed values 0.619 do not mean exact equality with the root. The reported behaviours are increasing convergence to from 0, decreasing convergence to from 1, and increasing divergence from 2. The next sign analysis explains them.
Use a difference graph and preserve the relevant interval
For Example 32(iv), consider the difference asked for:
The source suggests entering Y1=e^X−3X and Y2=(e^X−3X)/3. The second curve is a vertical compression of the first, retaining both roots and every sign:
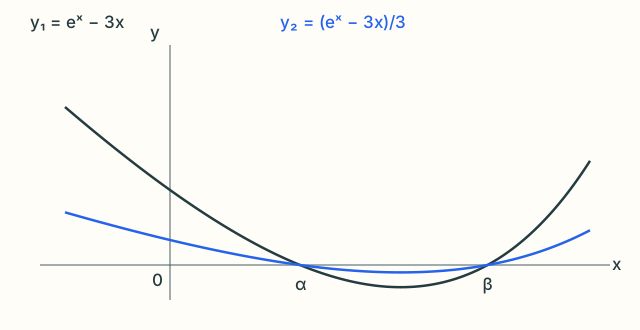
Between the roots the difference is negative; outside them it is positive:
The source uses these graph signs. An algebraic check is , while vanishes only at : the graph decreases to one minimum and then increases, giving the stated sign regions around its two roots.
For part (v), the source compares , and . To apply the sign result repeatedly, also check that later terms stay in the relevant region. The function is strictly increasing and fixes , so
Thus the sequences starting at 0 and 1 are respectively increasing/bounded above and decreasing/bounded below. Their finite limits must be .
The sequence starting at 2 increases and stays above .
If it had a finite limit, that limit would be at least 2, contradicting the only possible limits in (ii); hence it is unbounded and tends to positive infinity.
This interval/boundedness reasoning supplies the detail behind the observed behaviours. Increasing alone does not imply divergence.
Try these examples
Open an example in chapter practice. Try it first, then read its solution. Use “Learn this step” to return to this unit.