Original question & working
Read stationary points and slope limits · source reference
modified 2010/ACJC/Prelim/I/3 · Question pp. 2 · Working pp. 4
Open the interactive lessonThe working and teaching notes are included in the interactive lesson.
A value f(x)=2 at one point does not imply zero derivative. Read the actual slope behaviour.
Full original question, working & notes
Printed question
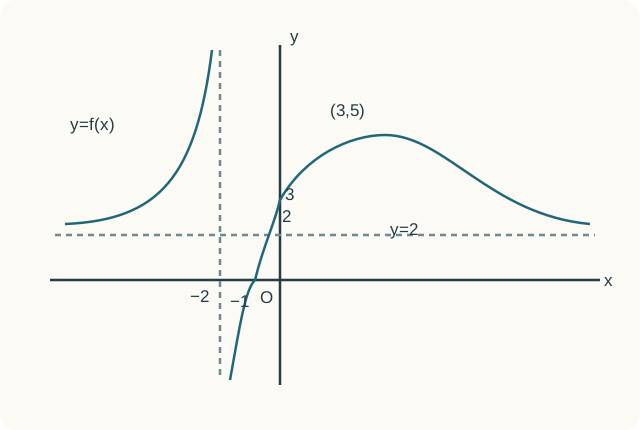
The diagram below shows the graph of . The curve cuts the axes at and . It has a maximum point at , and asymptotes and .
Sketch the graph of , showing clearly asymptotes, intercepts and coordinates of turning points, where available. [3]
[modified 2010/ACJC/Prelim/I/3]
Printed working
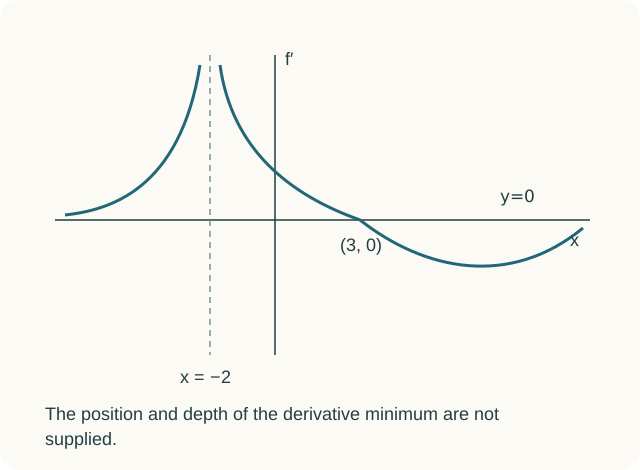
The derivative sketch has vertical asymptote , horizontal asymptote , intercept , positive branches before (excluding ), and a negative trough after tending to from below. No exact coordinates of that trough are supplied.
Teacher notes
-
Vertical asymptote remains. Horizontal asymptote of curve becomes horizontal asymptote of curve since, as curve approaches the horizontal asymptote, its gradient gradually approaches . The source shorthand is “”; this means the asymptotic gradient in the drawn curve, not equality of with everywhere.
-
Stationary point of curve becomes -intercept of curve as at a stationary point.
-
Map out the curve by tracing the gradient of curve as increases.
Answer key
Same derivative sketch as the detailed solution.
Native diagrams