Read stationary points and slope limits
The diagram below shows the graph of . The curve cuts the axes at and . It has a maximum point at , and asymptotes and .
Sketch the graph of , showing clearly asymptotes, intercepts and coordinates of turning points, where available. marks
[modified 2010/ACJC/Prelim/I/3]
Solution
Gradient graphs
The graph of cuts the axes at and , has a maximum point at and asymptotes and . Sketch , showing asymptotes, intercepts and the coordinates of turning points, where available.
Hint
Trace the gradient of the curve as increases.
The maximum gives the -intercept .
becomes ; stays.
The gradient of a curve levelling off at height 2 is 0, not 2.
The negative dip's depth is not given: label only what the question supplies.
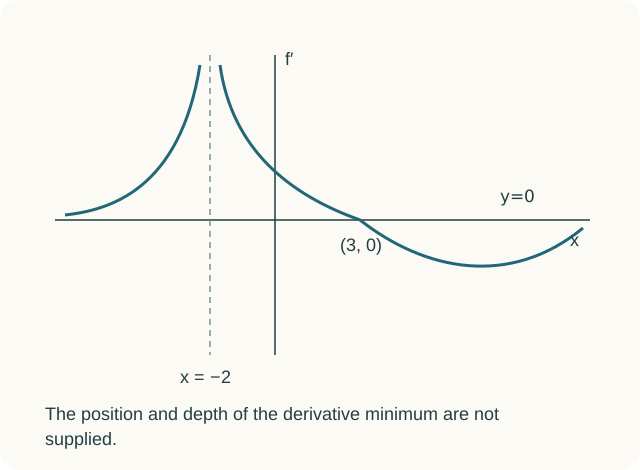
Answer · Derivative sketch
Zero ; asymptotes .
Positive for x<−2 and −2<x<3; negative for x>3. Turning-point coordinates beyond this are unspecified.
Stationary point
A horizontal tangent means zero gradient.
Signs
For the curve rises towards the vertical asymptote: . For it rises from to the maximum: . For it falls: .
Asymptotes
In this source sketch the tails gradually flatten towards height 2, with gradients tending to zero; near the gradients become unbounded. The printed shorthand describes this limiting behavior, not a constant function or a universal rule about asymptotes.
Right tail
After the maximum the gradient is negative, dips to a most-negative value (no coordinates are given for this), and then returns to 0 from below.
Explore the idea