Original question & working
A decreasing forest model stops at extinction · source reference
[2020/CJC/Prelim/II/4] · Question pp. 4 · Working pp. 16, 17
Open the interactive lessonThe working and teaching notes are included in the interactive lesson.
View source review notesFull original question, working & notes
Printed question
Botanists are studying how excessive logging is affecting the population of forest trees in a country in South-East Asia. The population of trees in a forest after years is denoted by , in thousands. One simple model proposed is that the population increases at a rate proportional to its population size. It is known that trees are chopped off at a constant rate of 3 thousand trees per year and the population stays constant when .
(i) Find a differential equation involving . [3]
(ii) The initial population of trees in a forest is 5 thousand trees. Solve the differential equation in part (i) and show that . [5]
(iii) Given that the population of tree decreases in a finite time, state an inequality satisfied by . Sketch the graph of against for this case, showing clearly the coordinates of the graph’s point of intersection with the horizontal axis. Hence explain the meaning of this axial intercept in the context of the question. [4]
[2020/CJC/Prelim/II/4]
Printed working
. Since population remains constant when , ; .
. .
; ; , ; .
At 0, : ; .
Population decreases, so .
At , ; ; .
The sketch starts at and meets the horizontal axis at . Starting from initial year , this is the time needed for the tree population to be fully depleted.
Printed answer key
(i) . (ii) . (iii) ; native sketch below.
Teacher note 1
. Population remains constant when , so when .
Teacher note 2
Given , constant, rearrange: , .
Need to put in the modulus sign when integration results in a logarithm, since its argument may be negative. In removing the modulus sign, remember to put in “”. Here may be negative. is in thousands; initial population 5 thousand means at .
Teacher note 3
Population decreases over time: as increases, decreases. Since and increases with , . Time cannot be negative, so ; no sketch for .
Diagram 10-12-extinction
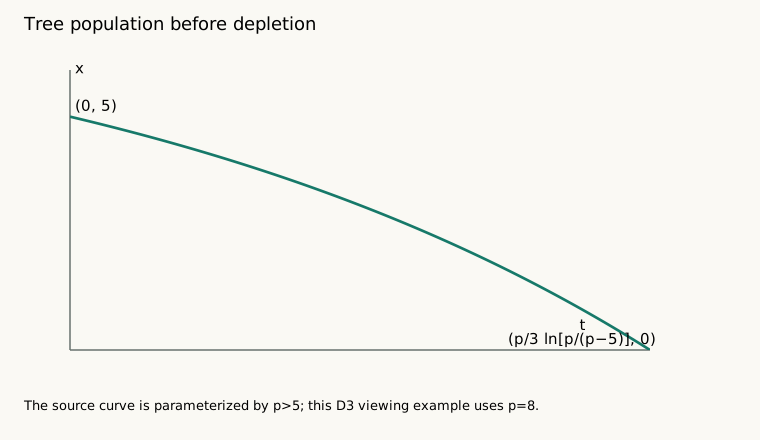
The source curve applies for every ; this viewing example uses . The symbolic extinction-time label is retained.
Mathematical review
(i) with k>0. Equilibrium at p gives k=3/p, with p>0.
(ii) Separate to obtain . The initial value gives A=5−p, as required.
(iii) Decrease from 5 requires 5−p<0, so p>5. The curve starts at (0,5), decreases with negative second derivative, and reaches x=0 at . This means all modeled trees are gone. Restrict the contextual solution to : the negative continuation is not a population. If p=5, the population stays constant; p<5 predicts growth.
Provenance
TJC JC2 2025 H2 Maths (9758) MSM. Native transcription checked against original visible question, working and sidebars. Question page(s): 4. Working page(s): 16, 17. Original records remain private for QA; this native article has no PDF or raster worksheet dependency.