Turn a curve sketch into its gradient graph
The diagram shows the graph of . The curve passes through the origin , the points and . The points and are stationary points and the lines and are asymptotes of the curve.
Sketch the graph of , indicating clearly the points corresponding to , , and , and the asymptotes, where applicable. marks
[modified 2010/RVHS/Prelim/II/1]
Solution
Gradient graphs
The graph of passes through , and . and are stationary points, and and are asymptotes. Sketch , marking the points corresponding to , , , and the asymptotes.
Hint
Trace the gradient from left to right: positive when the curve rises, negative when it falls.
Stationary points become -intercepts of .
Carry the vertical asymptote across and turn the horizontal asymptote into for the gradient.
and lie **on the -axis**: the heights 2 and −2 of the original are not gradients.
A horizontal asymptote alone does not guarantee that the derivative tends to zero. Here the source sketch shows gradually flattening tails; even then, a limiting gradient of zero does not mean the gradient vanishes at a finite input.
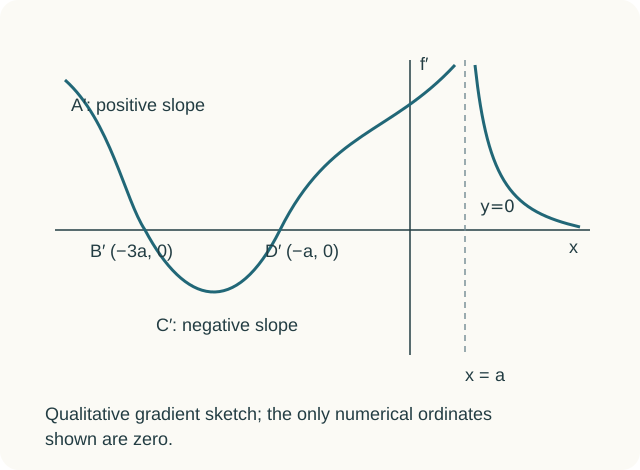
Answer · Derivative sketch
Zeros ; asymptotes .
A′ has positive slope ordinate, C′ negative; their numerical ordinates are unspecified. Limits follow the particular source sketch.
Stationary points
At a stationary point the tangent is horizontal, so the gradient is 0. The gradient graph crosses the -axis at and .
Signs between them
From up to the curve rises: . From down through to it falls: . From up through towards the asymptote it rises: .
At and
The curve passes through going up (so there) and through going down (so ). We are not given the numerical gradients.
Asymptotes
For the supplied sketch, gradients become unbounded near and tend to zero along the flattening tails. These conclusions use the drawn gradient behavior, not a general rule that all asymptotes survive differentiation.
Explore the idea