Definite integrals, areas and volumes
← Back to lesson · Complete chapter reading and print view · Open reference notes separately
By the end, you can
- Interpret integrals as limits of sums and signed accumulation
- Calculate areas between curves
- Use discs or washers for volumes of revolution
about 30 minutes for the lesson · practise at your own pace.
The central idea
A definite integral accumulates signed contributions and can be evaluated by F(b)−F(a) when F′=f under the fundamental theorem. Geometric area is nonnegative, so split where the curve crosses an axis or two curves exchange order. Revolving a region produces cross-sectional discs or washers; integrate their areas.
Rectangle sums and the limiting integral
Divide into n equal intervals of width . Each rectangle has area height times width. With the source indexing , , left heights give and right heights give .
For continuous f, both sums tend to as and . The finite expressions are Riemann sums; their limit is the integral. For the source curve above the axis, that limit is area A. Signed integrals need care when a curve crosses the axis.
The teacher annotations emphasise total rectangle area and taking a limit. Left endpoint i is ; the handwritten alternative is its right endpoint. Sketch the region before selecting bounds, differences of areas or a solid of revolution.
The source’s historical note identifies Georg Friedrich Bernhard Riemann, a German mathematician of the nineteenth century. Its “Limits” callout links limits to the development of calculus and area under a curve; its “Diagrams” callout recommends sketching before identifying areas, formulating integrals or modelling a solid of revolution. The Teacher shades endpoint rectangles, underlines height times width and highlights the limiting step.
The source calls the displayed limit a “Riemann Sum”; here the finite sum is the Riemann sum and its limit is the definite integral.
Its right-endpoint diagram is followed by a printed expression using the earlier left indexing; keep for the right-endpoint sum with .
Both converge to the same integral.
A finer partition converges for this continuous curve, but its approximation error need not decrease at every individual value of .
Antiderivatives and the fundamental theorem
If is continuous on and , then . The lower and upper limits are and . For example, an antiderivative of is ; the arbitrary constant cancels in the subtraction.
Five useful properties
For continuous and constant : ; ; for ; ; and . The source prints for the last rule, but it also holds for .
Continuity on the whole interval matters for this version of the theorem. The source warns against evaluating by direct substitution: is undefined at zero. Its improper integral diverges to positive infinity; a formal endpoint subtraction does not evaluate it.
Signed integrals and geometric area
For a nonnegative curve on , . For a nonpositive curve, . If the curve is above the axis from to and below it from to , add positive areas: . Sketch first, find every zero inside the bounds, and split wherever the sign changes.
For the source sine example, and . Origin symmetry makes the two geometric areas equal to each. Their combined geometric area is , while .
The Teacher points out odd/even symmetry for integrals on . For continuous odd , the integral is zero; for continuous even , it is . The additional cosine query is . Its zero result comes from evaluation of the even-function half-interval integral, rather than odd symmetry.
Horizontal strips and integration with respect to y
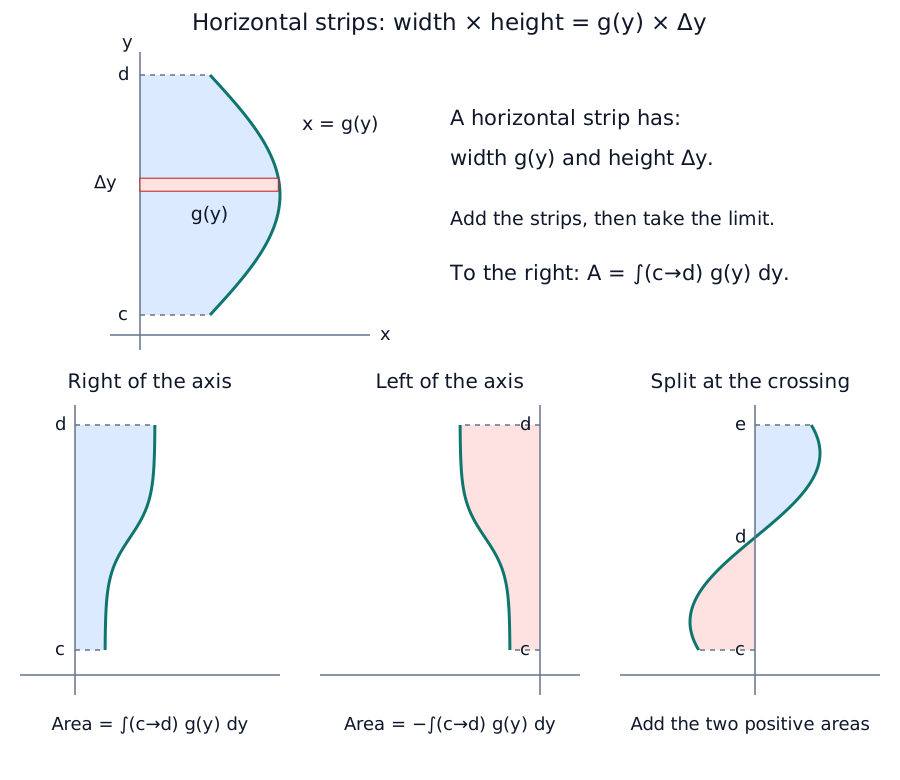
For a continuous curve , bounded by the y-axis and , , use horizontal strips. A strip has width and height , so its area is when . Adding strips and taking the limit gives for a region to the right of the y-axis.
For a region to the left, , use . If the curve is left of the axis on and right on , add the positive pieces: . Find the y-coordinate where the curve crosses the axis before splitting. Width, not height, is now the function of the integration variable.
Areas between curves
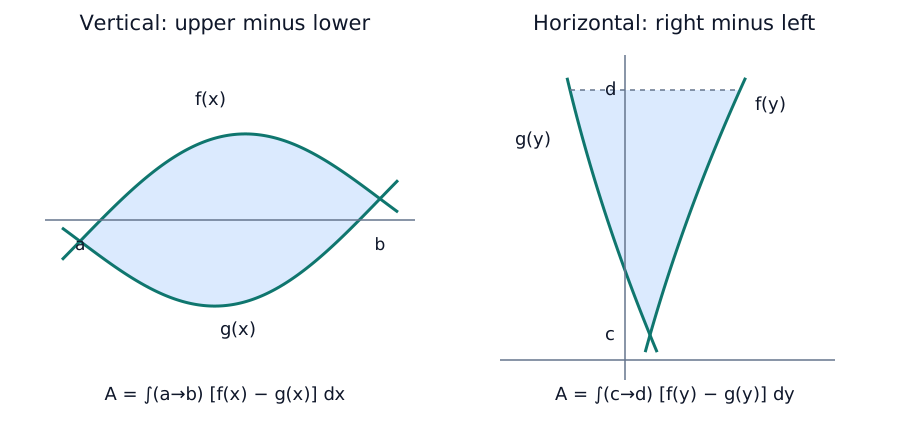
The source asks for the area between and from to . In its first picture both are above the x-axis and , so subtract the area under from the area under : .
The same upper-minus-lower strip width works anywhere in the plane, including below the x-axis. In that case do not describe each signed integral separately as an unsigned geometric area: the difference is the positive vertical distance. If the curves exchange order, find the crossings and split before adding areas.
For horizontal strips between on the right and on the left, use . The summary rule is upper minus lower with x bounds, or right minus left with y bounds. Find the intersection coordinates to obtain the limits. A line is another curve, so the same rule applies; a triangle or trapezium can sometimes replace one of the simpler integrals.
Volumes as limits of disc sums
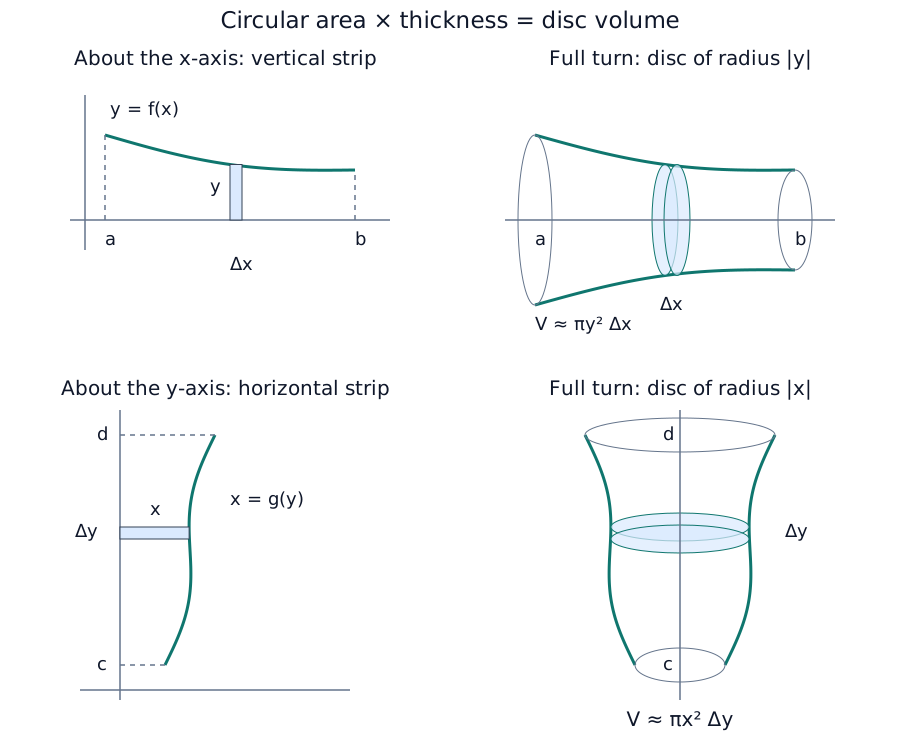
A complete rotation of a plane region about a line in its plane forms a solid of revolution; the line is the axis of revolution. For a nonnegative continuous on , rotate the region down to the x-axis through or radians. Divide the interval into equal widths . Rotating a rectangle creates a circular disc with radius and thickness . Its volume is , from circular area times thickness.
The finite disc sum is . As and , . The finite expression is a Riemann sum for volume; its limit is the integral. The Teacher highlights the squared radius and the limiting step.
For rotation about the y-axis, write first and use horizontal strips of thickness . A disc has radius and volume approximately , so . The printed formula is correct; a nearby Teacher handwritten does not match this y-axis setup and must not replace it. Match the radius, thickness variable and limits to the chosen axis.
Cylinders, cones and a translated axis
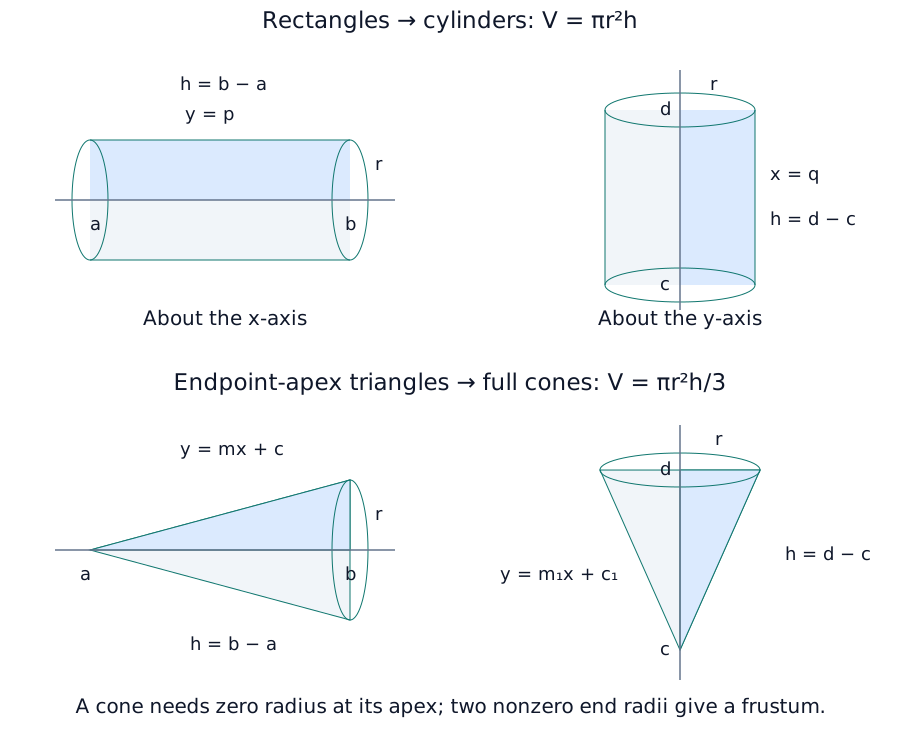
The source asks which solid is formed by rotating either (a) the rectangle between the x-axis, and about the x-axis, or (b) the rectangle between the y-axis, and about the y-axis. Both form a cylinder, with . In (a), and ; in (b), and (bounds increasing).
It then asks about rotating a straight-line boundary () about the x-axis, or () about the y-axis. The drawn triangular regions form a cone, with .
In the source drawings the radius vanishes at an endpoint, which is essential for a full cone.
The general straight-line wording needs this qualification: if both endpoint radii are nonzero on the same side, the solid is a frustum; if the line crosses the axis inside the interval, split the region instead of applying one cone formula indiscriminately.
For an axis parallel to a coordinate axis, translate the graph and its axis together until that axis coincides with x=0 or y=0. This preserves all radii and the generated volume, as in Example 16.
Washers between two curves
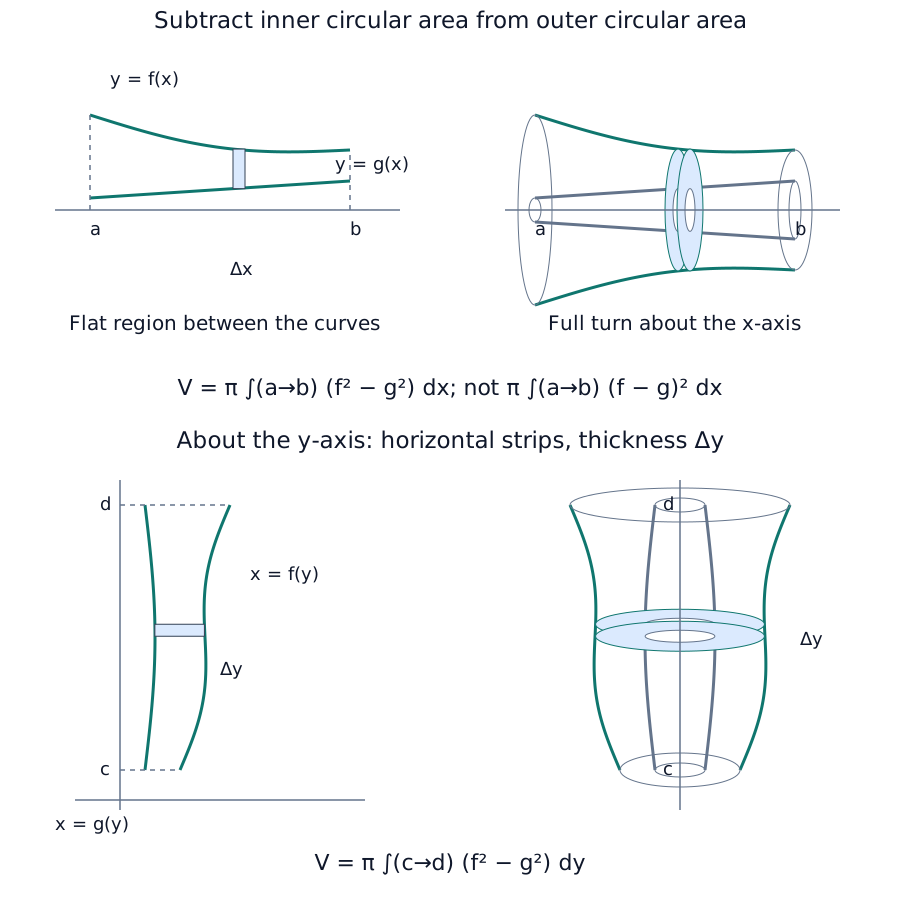
For throughout , a full x-axis turn of the region between the curves gives outer radius and inner radius . A washer has area , so . Subtract the inner solid from the larger one. This is not ; square the two radii separately before subtracting.
For y-axis washers with on , rotate the region between and through a full turn. Then . The horizontal strip becomes an annular disc with thickness .
The Teacher’s closing summary is: for the x-axis use (or outer squared minus inner squared); for the y-axis use (or the corresponding difference); for other parallel lines, translate region and axis together. Rewrite the radius in the chosen integration variable before comparing inner and outer boundaries.
From the source curve to left and right rectangle sums
Compare left and right rectangle sums
Illustrative curve f(x) = 2 + x − x² on [0, 1.5]. Change the strip count and endpoint rule; the source drawing supplies a rising-then-falling shape, not this formula.
Teaching and source notes
The original shows the area A, then left heights f(xᵢ) and right heights f(xᵢ₊₁), with equal width Δx = (b − a)/n. The explorer keeps those choices and adds a midpoint comparison using the existing workbench.
The chosen numerical example rises and then falls. Its exact integral is [2x + x²/2 − x³/3] from 0 to 1.5, which is 3. The formula, bounds and value are illustrative, not extra givens in the source.
On a nonmonotone curve, the endpoint name alone does not prove that a sum is below or above the integral. Inspect the whole interval. Increasing n numerically illustrates convergence; it does not prove the general theorem.
Signed integrals and areas
Equal areas, opposite signed integrals
Use the source sine intervals: [−π, 0], [0, π] and [−π, π]. Compare the signed integral with the total geometric area. Decimal axis labels approximate the exact preset bounds.
Teaching and source notes
The source sine regions each have geometric area 2. Their signed integrals are −2 and +2, so the combined signed integral is 0 while the geometric area is 4. The explorer retains those exact preset intervals in radians.
For a region above the axis, area is the integral. Below the axis, area is the negative of the integral. Across a sign change, split the interval and add the nonnegative areas; taking the absolute value of the combined integral can lose area.
Shaded running areas are numerical estimates, compared with the antiderivative −cos x. Rounded numerical agreement does not replace the analytic evaluation or the sign split.
Horizontal strips and the y-axis
Expand diagramFit diagram to page
Use the scrollbars or arrow keys to inspect details.
Derive upper minus lower
Build area from upper minus lower
Illustrative curves f(x) = 2x − x² and g(x) = x² on [0, 1]. Inspect a strip's two heights before multiplying their difference by its width.
Teaching and source notes
The source derives A = F − G by subtracting the area under the lower curve from that under the upper curve, between their meeting points a and b. The numerical formulas here are labelled illustrative rather than attributed to the original sketch.
For f(x) = 2x − x² and g(x) = x², f − g = 2x(1 − x) is nonnegative on [0, 1]. The curves meet at both endpoints. Integrating the upper curve gives 2/3, the lower gives 1/3, and their difference is 1/3.
The same bounds and consistent upper/lower ordering are essential. If curves cross within an interval, split before summing geometric areas. A finite strip sum is still an approximation.
Choose vertical or horizontal strips
Expand diagramFit diagram to page
Use the scrollbars or arrow keys to inspect details.
A strip rotates into a disc
Expand diagramFit diagram to page
Use the scrollbars or arrow keys to inspect details.
Recognise cylinders and full cones
Expand diagramFit diagram to page
Use the scrollbars or arrow keys to inspect details.
Strips rotate into washers about either axis
Expand diagramFit diagram to page
Use the scrollbars or arrow keys to inspect details.
Explore
For on , predict whether left- and right-endpoint rectangle sums lie above or below the integral.
In a spreadsheet or calculator, use n equal strips with width and compare . Keep a column for height times width, then sum it.
Compare both sequences with the exact integral and explain why their separation shrinks.
State which property of this curve justifies the ordering; endpoint choice alone does not give that ordering for every curve.
Related interactive example
Explore this related example, then return to the prediction task above.
Worked example
For on , . The geometric area is two triangles, each area 1/2, so total area is 1. Cancellation explains the difference.
A signed integral can be zero even when a region has positive area.
Check your understanding
The curves and enclose a finite region. Find its area and the volume when the region makes a full revolution about the x-axis. Establish the limits, identify the outer and inner radii, and explain why the two integrands differ.
The intersections satisfy , giving . Between them . The area is
The washer has outer radius and inner radius , so
Area accumulates vertical strip heights; volume accumulates cross-sectional washer areas. Squaring the height difference would give a different solid and is not the washer construction.
Mastery learning objectives
At the end of this chapter, I should be able to:
Choose a practice question
The source checkpoints are after lecture and after tutorial. Its area interpretation assumes a nonnegative curve with increasing bounds; in general a definite integral gives signed accumulation. For geometric area, split at sign changes and take the appropriate nonnegative contributions.
The source question map is reproduced below. Lecture references use the printed Example numbers; Discussion and Review refer to the chapter question sets. Blank cells mean the source gives no reference.
| Common question type | Lecture examples | Discussion | Review problems (follow up) |
|---|---|---|---|
| Definite integral as a process of summation | Q1, Q2 | Q1 | Q1 (first part), Q2 |
| Integration of ; source prints | Q3 | ||
| Definite integrals of , , or | Q3 | ||
| Partial fractions / splitting the numerator | Q2 | ||
| Piecewise function | Q4 | Q12(b) | |
| Integration by parts | Q5 | Q5(a) | Q4, Q6(a), Q7(b), Q8(a), Q11(i) |
| Integration by substitution | Q4, Q20(i) | Q7 (first part) | Q7(a) |
| Integration involving modulus | Q21 | Q6(b) | |
| Area | Q7, Q8, Q9, Q10, Q11, Q12, Q13, Q19(i), Q20(ii) | Q6, Q7(i) | Q5(a)(i), Q9(i)(iii), Q10(ii), Q11(iii), Q13, Q14(i) |
| Volume | Q14, Q15, Q16, Q17, Q18, Q19(ii) | Q5(b), Q7(ii), Q8, Q9 | Q1 (last part), Q5(a)(ii), Q8(b), Q9(ii), Q10(iii), Q11(iv), Q12(a), Q14(ii)(iii) |
Printed restriction correction: the power-rule row prints in both copies. For , the exceptional exponent is . At that exponent use on an interval where . Apply the real-domain conditions of the chosen power. The original printed wording remains retained in the native transcription.
Practice questions
Practice section 1 · Questions 1–6
From four rectangles to an exact area · A reciprocal area and the endpoint choice · +4 more
Practice section 2 · Questions 7–12
Evaluate an integral on the graphing calculator · Approximate an integral with a square root · +4 more
Practice section 3 · Questions 13–18
Use horizontal strips for an inverse-sine boundary · Split three horizontal area pieces · +4 more
Practice section 4 · Questions 19–24
Use symmetry for a half-turn and translate the rotation axis · Subtract the inner solid from the outer solid · +4 more
- Use symmetry for a half-turn and translate the rotation axis
- Subtract the inner solid from the outer solid
- Choose the outer radius after rewriting in terms of y
- Use different regions for area and revolution
- Reuse a substitution result in a circle-area problem
- Compare modulus integrals using algebra and geometry
Practice section 5 · Questions 25–30
Take the limit of left-rectangle areas · Integrate partial fractions with logarithm and arctangent terms · +4 more
- Take the limit of left-rectangle areas
- Integrate partial fractions with logarithm and arctangent terms
- Determine a parameter from two exact integrals
- Integrate a periodic piecewise function
- Evaluate an improper logarithmic integral and a revolution volume
- Equate areas using horizontal and vertical strips
Practice section 6 · Questions 31–36
Find a circle–parabola area and half-turn volume · Compute a composite solid by two methods · +4 more
Practice section 7 · Questions 37–42
Integrate a polynomial times sine twice by parts · Derive ellipse area, ellipsoid volume and sphere surface area · +4 more
- Integrate a polynomial times sine twice by parts
- Derive ellipse area, ellipsoid volume and sphere surface area
- Compare an arcsine integral with an absolute-value area
- Reverse reciprocal-substitution bounds and reuse an integral
- Combine inverse-sine integration with two rotation radii
- Use horizontal strips for an inverse-sine region
Practice section 8 · Questions 43–48
Split an absolute integral at the sign change · Transform a square-root exponential volume · +4 more
- Split an absolute integral at the sign change
- Transform a square-root exponential volume
- Read a selected region before splitting rotation disks
- Distinguish a logarithm from its absolute-value graph
- Repeat a logarithmic segment with the correct jump values
- Use inverse symmetry to integrate only half the lens
Practice section 9 · Questions 49–50
Compare two slice directions and translate an axis of rotation · Compare work along a curved and straight path
More practice
Sketch the selected region or rate, identify any sign changes and choose the strip direction or radii. Interpret what the integral accumulates before calculating.
Ready to try this on your own?
For “Definite integrals, areas and volumes”, try a question without the working and explain your method. This records your confidence, saved in this browser only.